Introducing Kiali for Observability
All of your microservices are running in the service mesh. Now, you need a way to visualize the service mesh topology. That is, what’s running in your service mesh and how are they connected?
Istio provides Kiali, an open source project that gives you a console view of your service mesh. You can inspect the health of your service mesh, and it has further integrations for metric querying and tracing that we will cover in later labs.
Explore Kiali
First, let’s send some load to the application.
Send load to the application user interface:
for ((i=1;i<=100;i++)); do curl -s -o /dev/null $GATEWAY_URL; done
Send load to the user profile service:
for ((i=1;i<=100;i++)); do curl -s -o /dev/null $GATEWAY_URL/profile; done
Now let's open the Kiali console. Retrieve the endpoint for Kiali:
KIALI_CONSOLE=$(oc get route kiali -n istio-system --template='https://{{.spec.host}}')
echo $KIALI_CONSOLE
Output:
https://kiali-istio-system.apps.example.redhatgov.io/
Navigate to this URL in the browser. Login with the same credentials you were provided to access OpenShift.
Once logged in, you should be presented with the Kiali console:
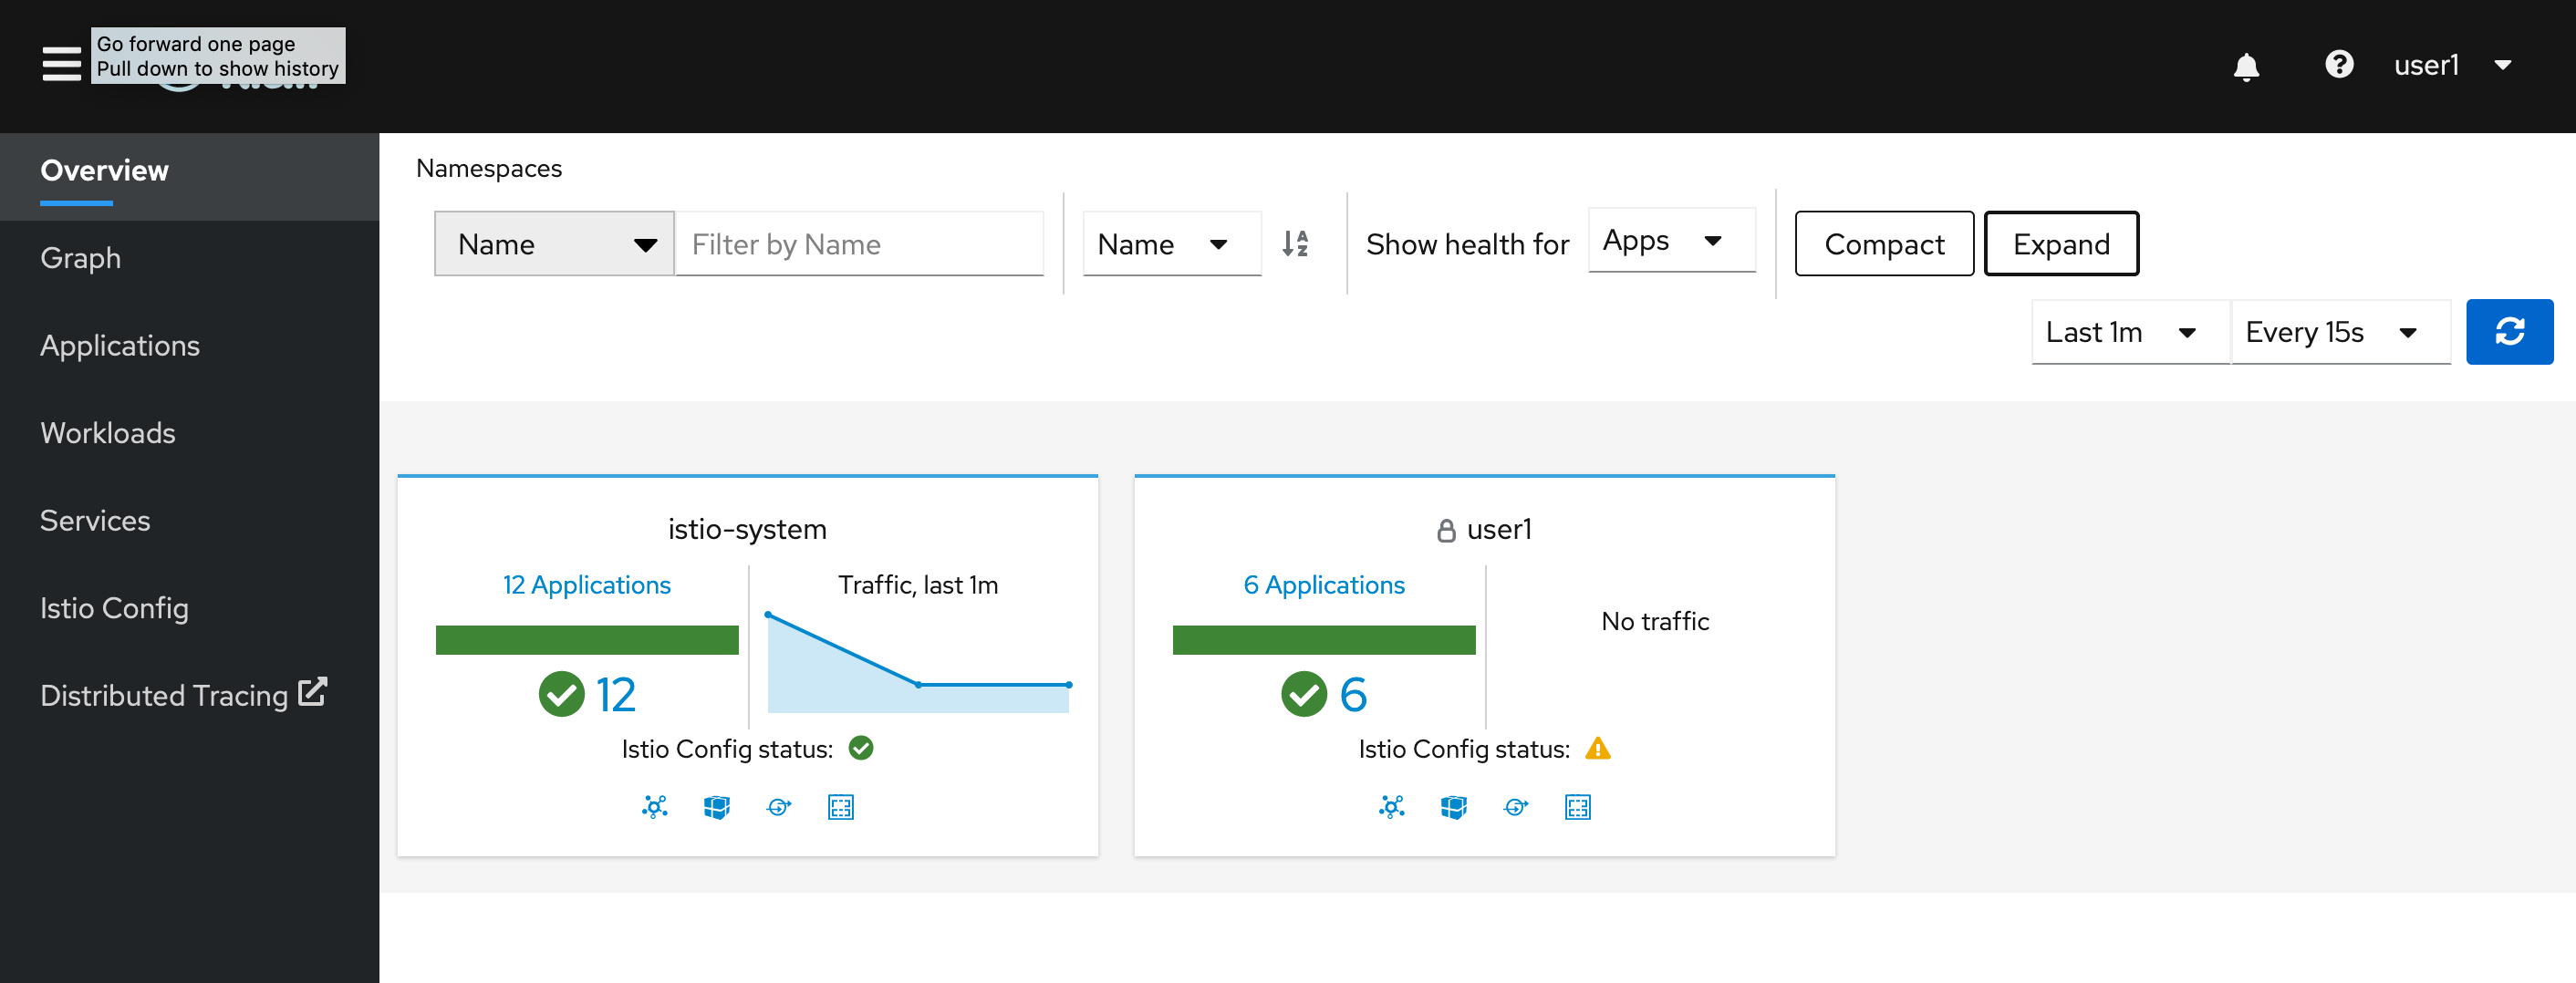
Kiali Welcome
Let’s take a look at the service mesh topology.
Navigate to 'Graph' in the left navigation bar and select your namespace (e.g. user1).
Now change the window of the view on the right side from 'Last 1m' to 'Last 10m'.
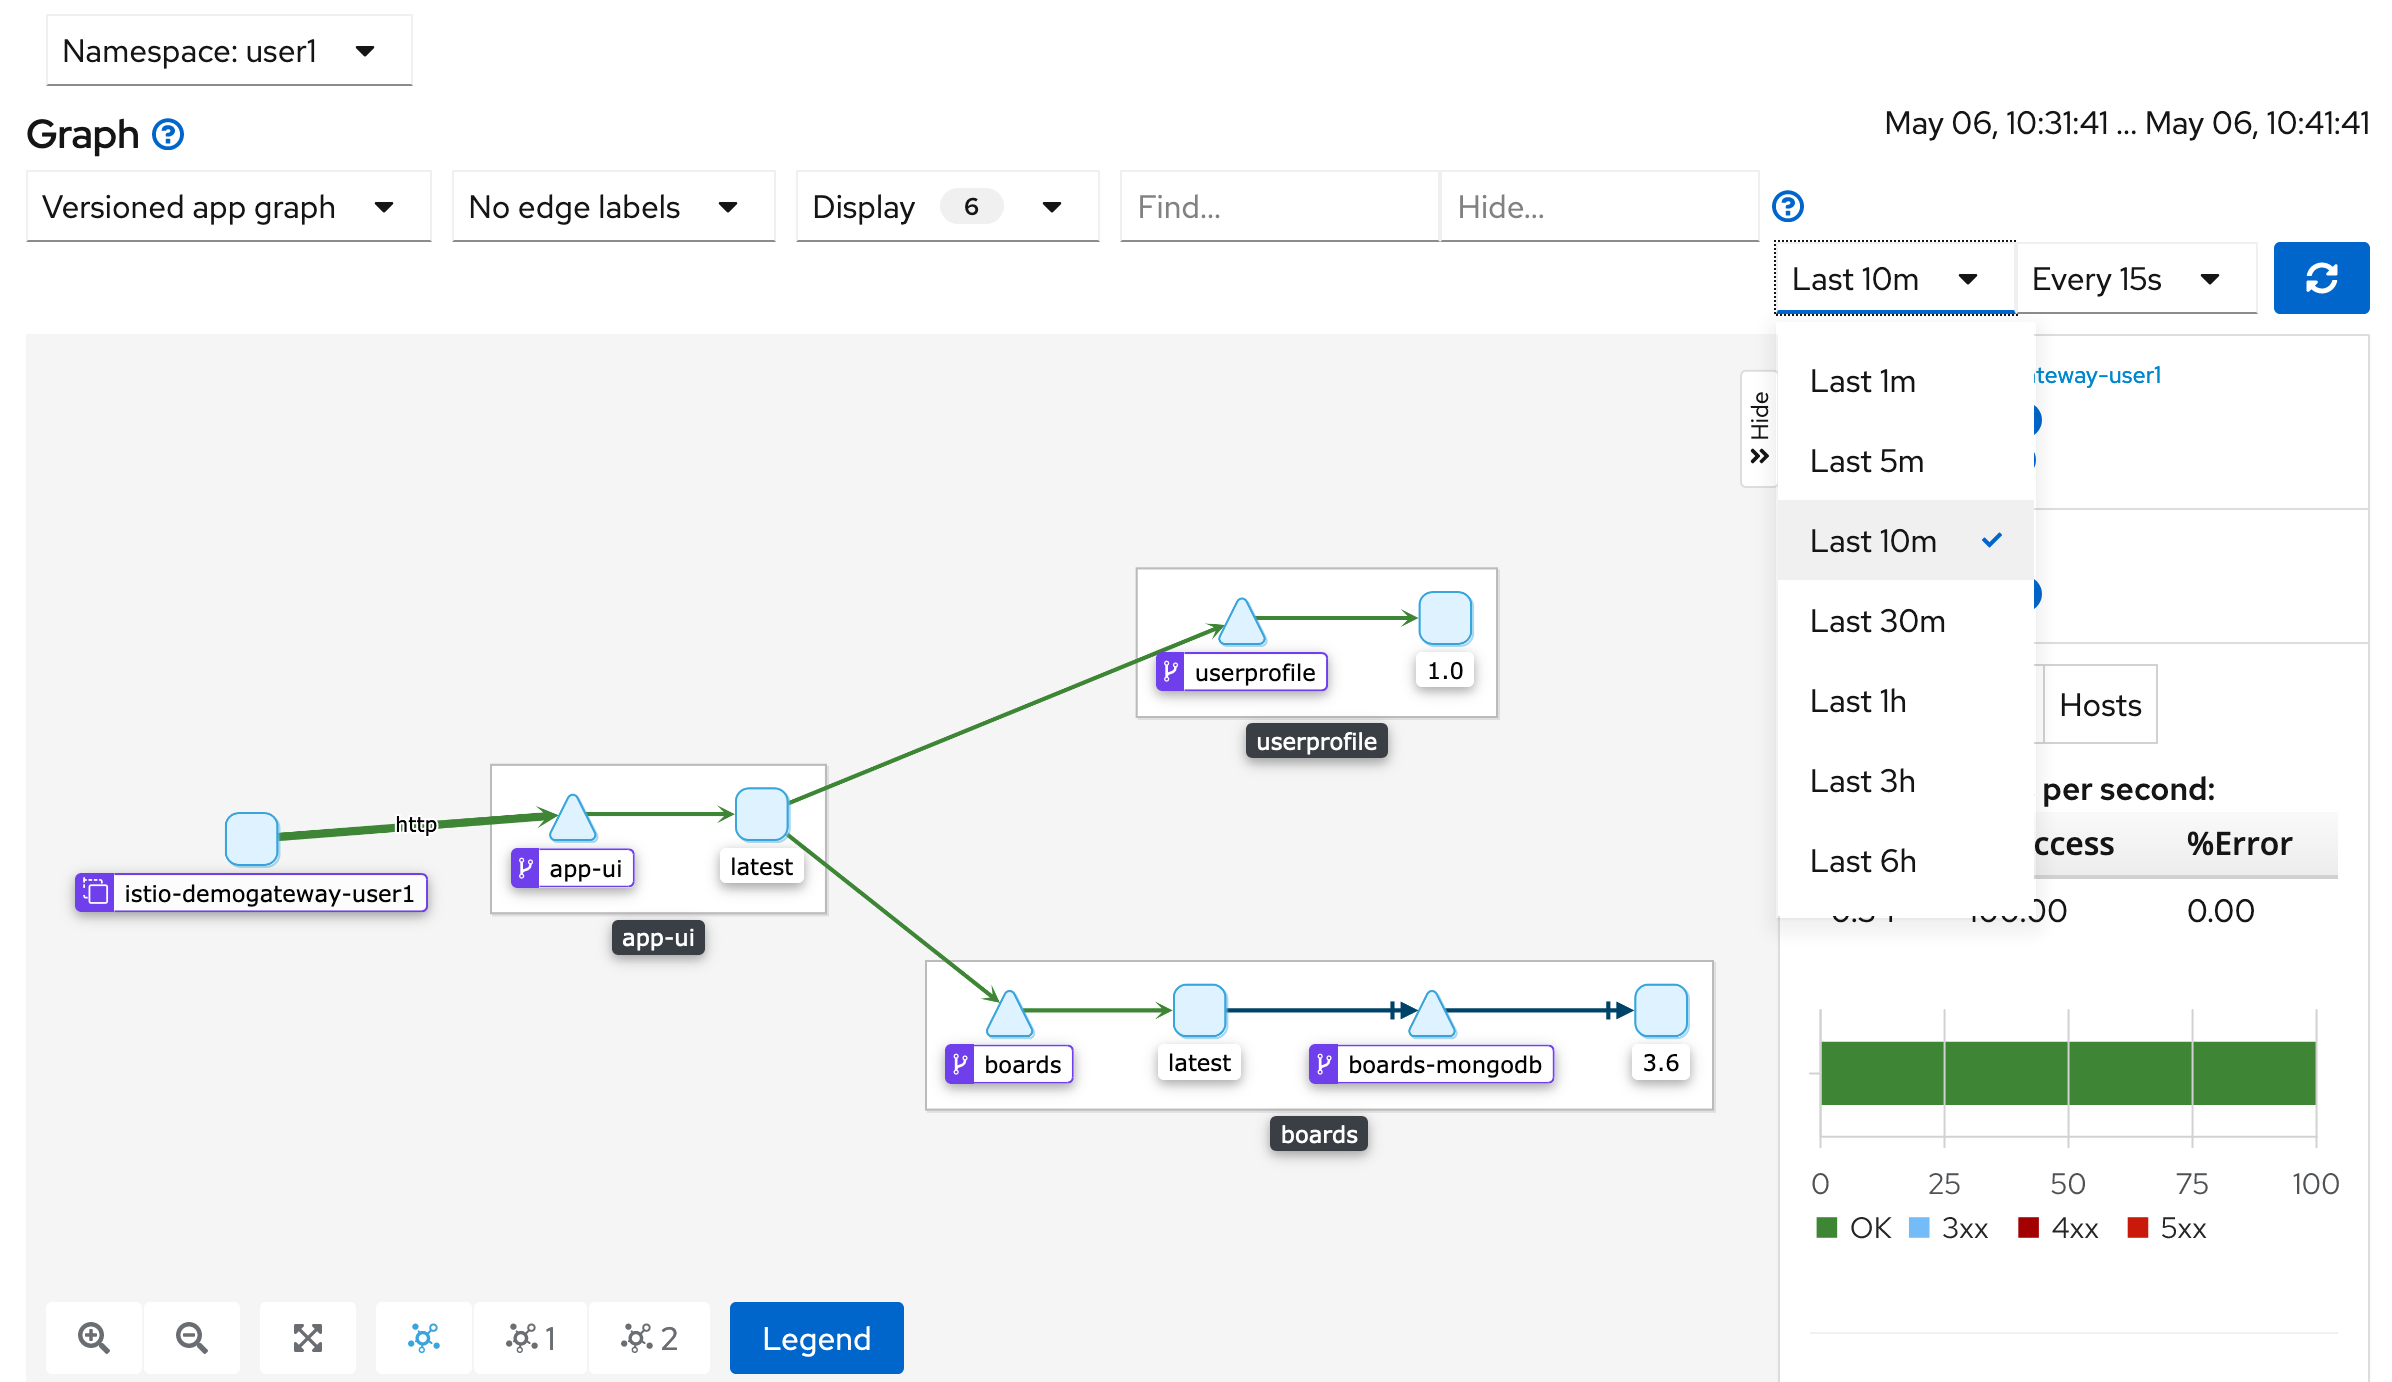
Kiali Graph
The graph shows the microservices in your service mesh and how they are connected.
You can inspect information about the traffic being sent between the services via the edge labels.
Click 'No edge labels' and switch to 'Requests per second'.
You can now see HTTP traffic information between the microservices.
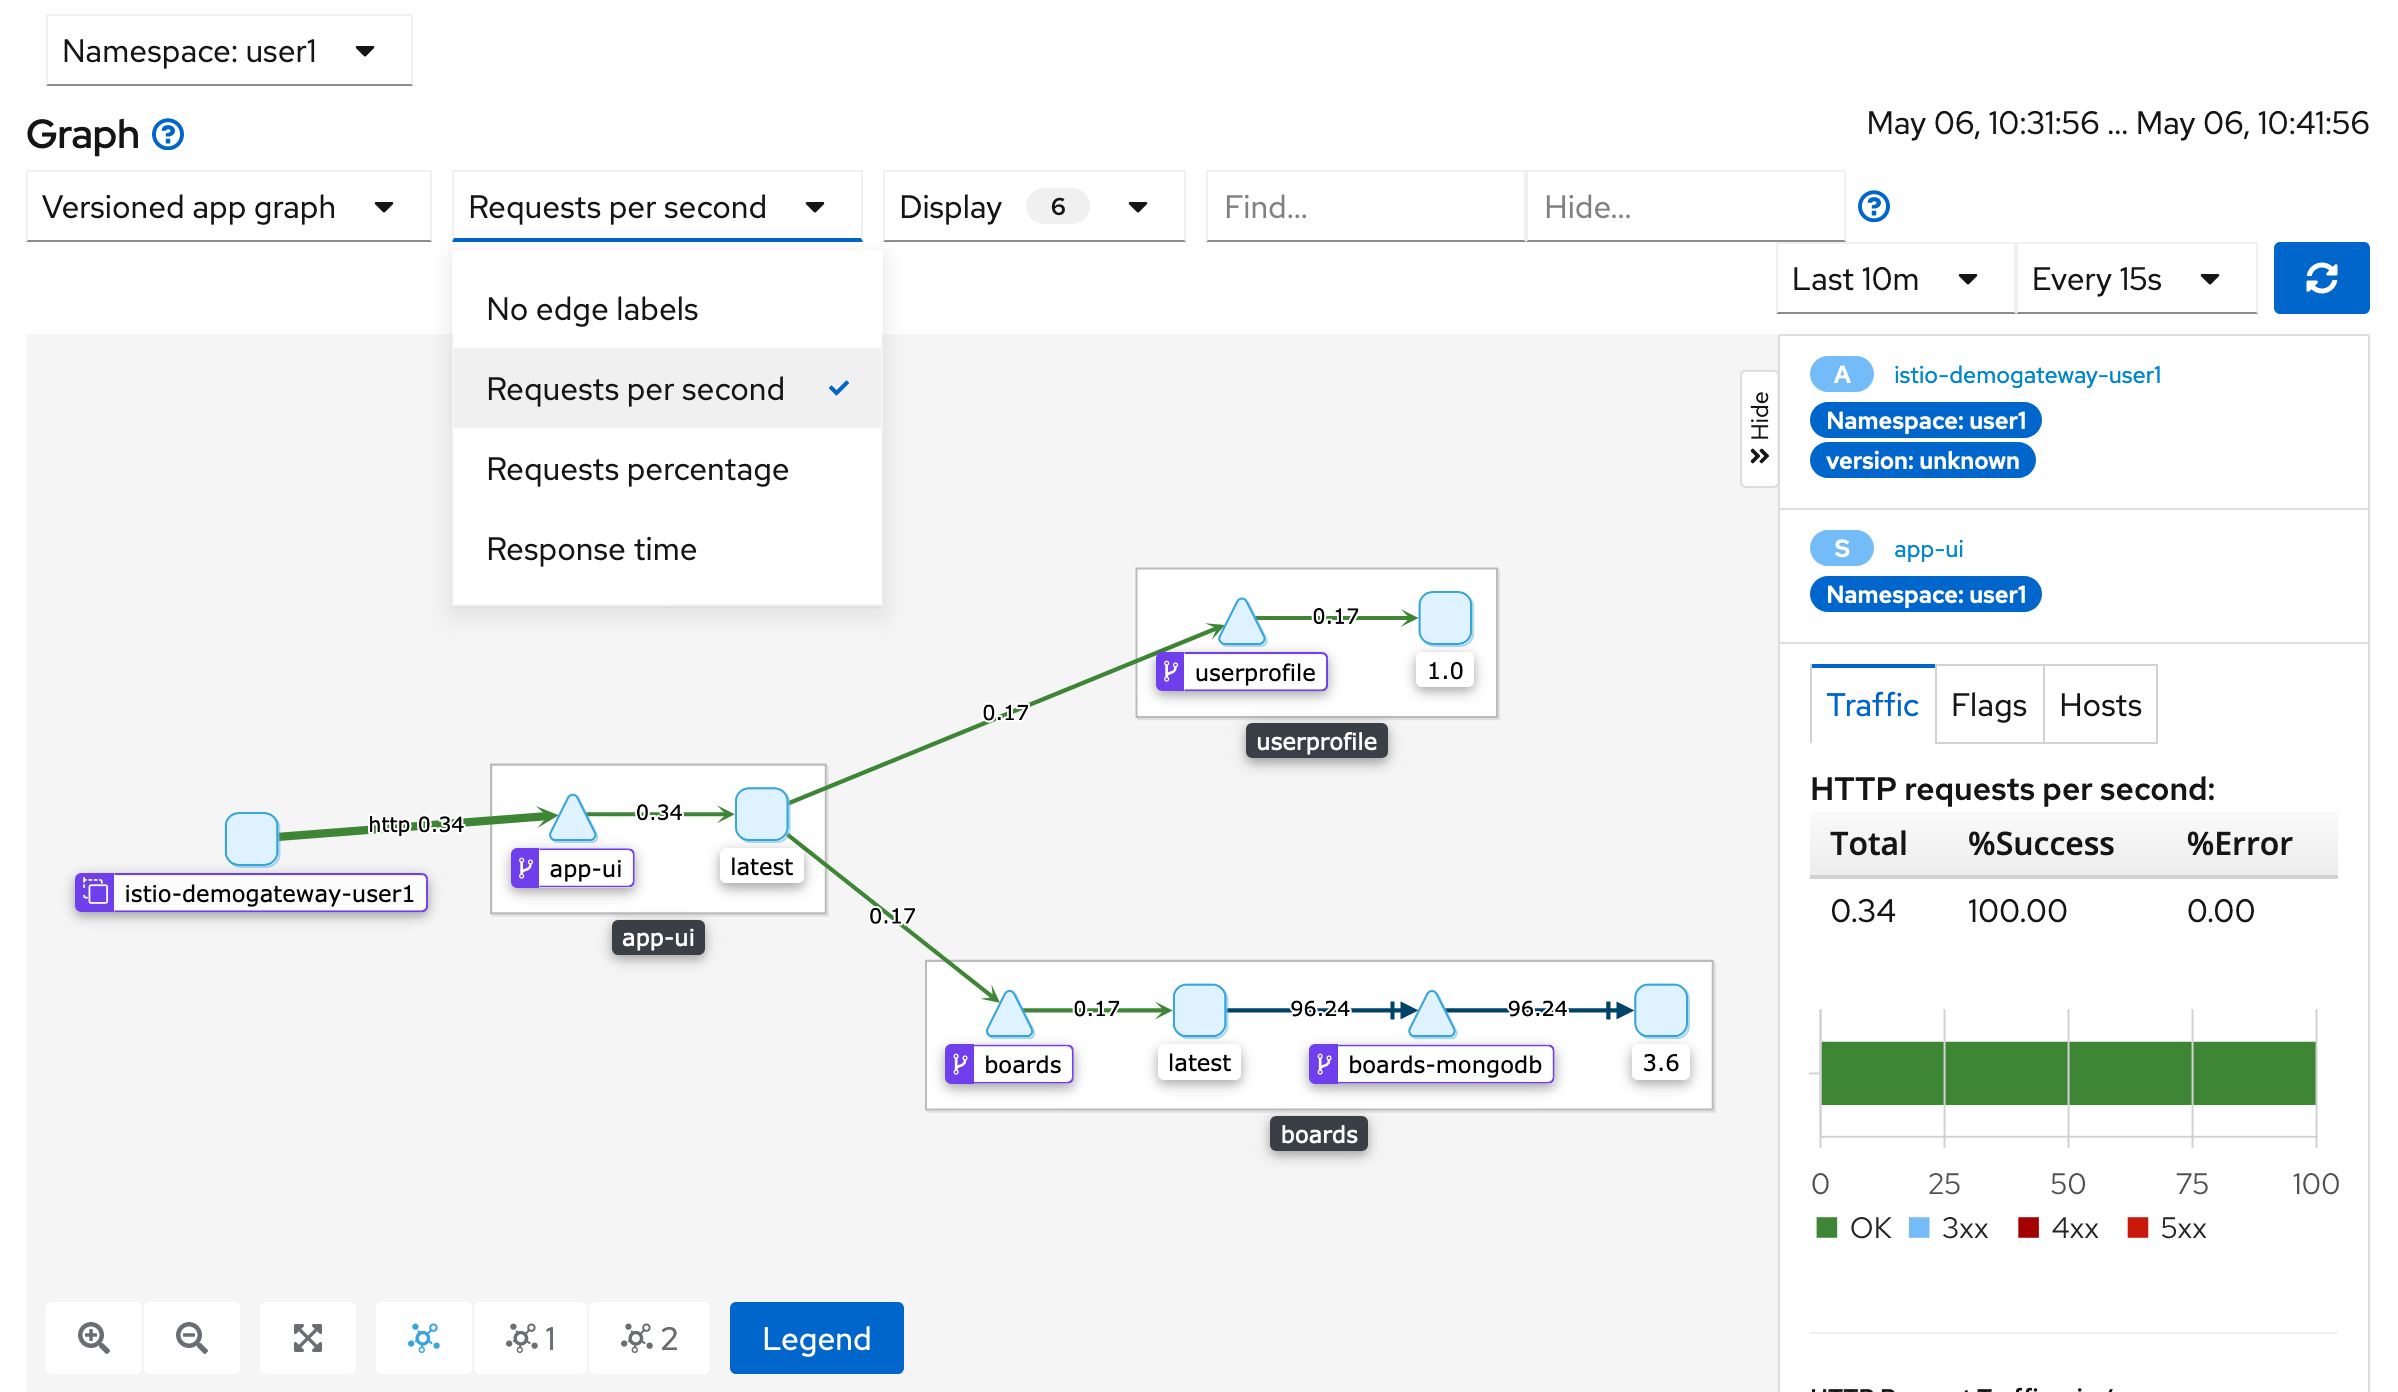
Kiali Graph with Requests Per Second
Let’s take a look at the microservices running in your service mesh.
Navigate to 'Applications' in the left navigation bar.
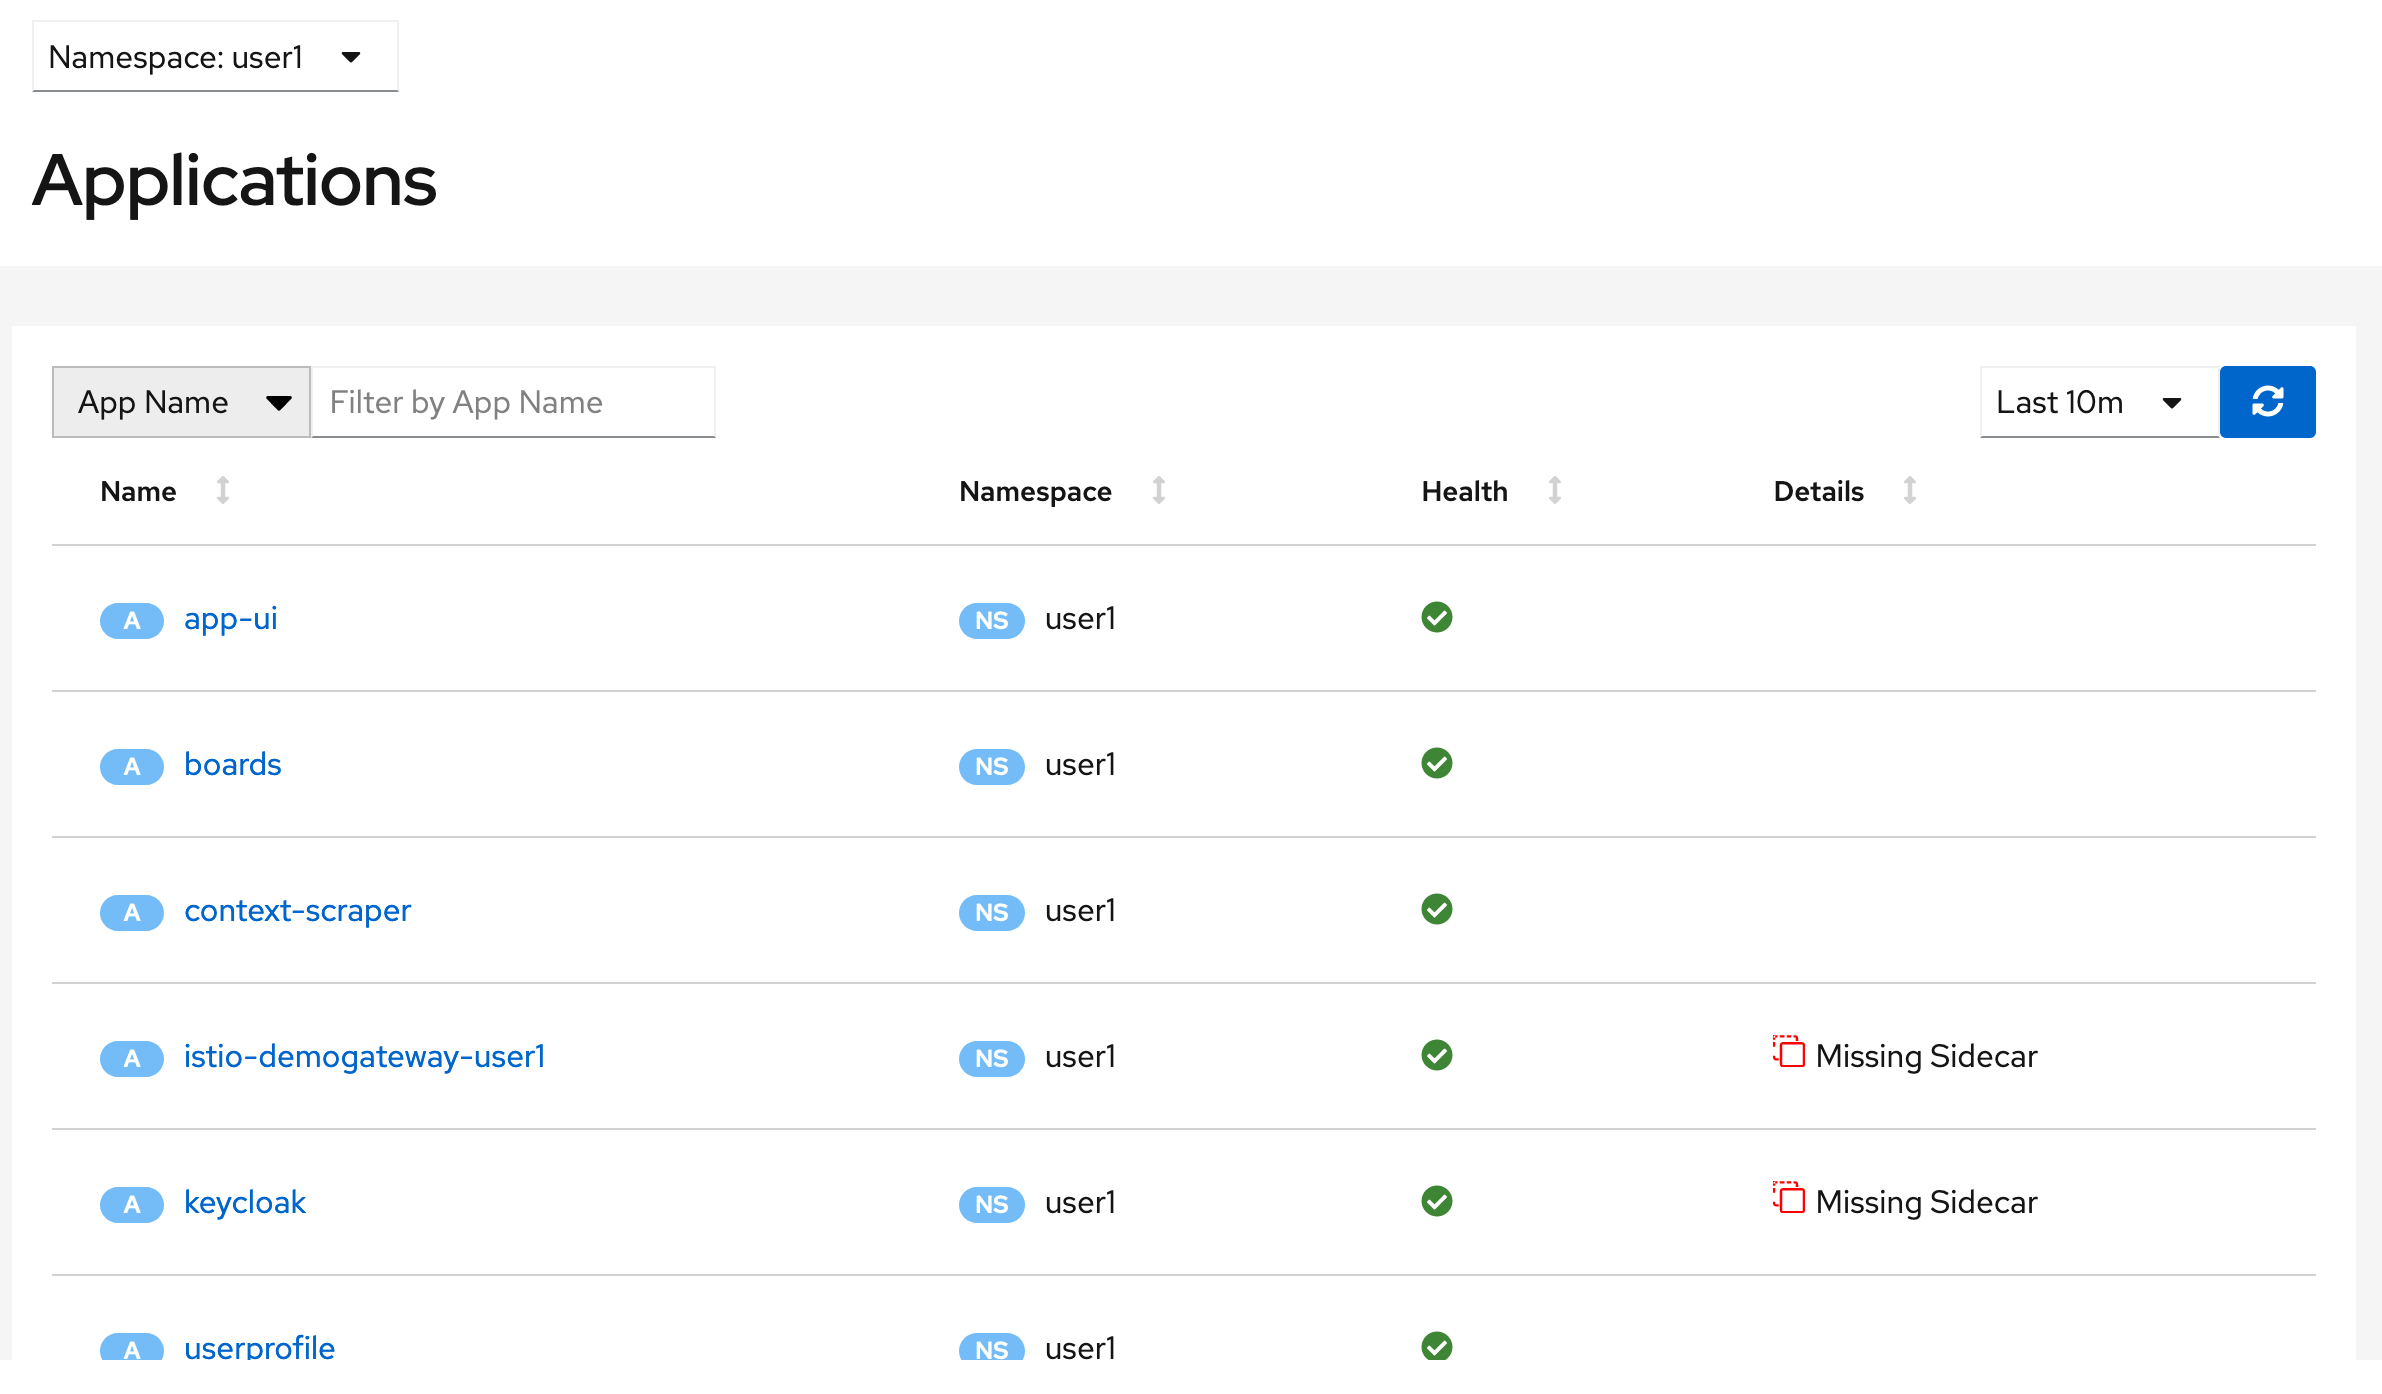
Kiali View of Applications
You can drill down into each microservice from this view. Select 'app-ui'.
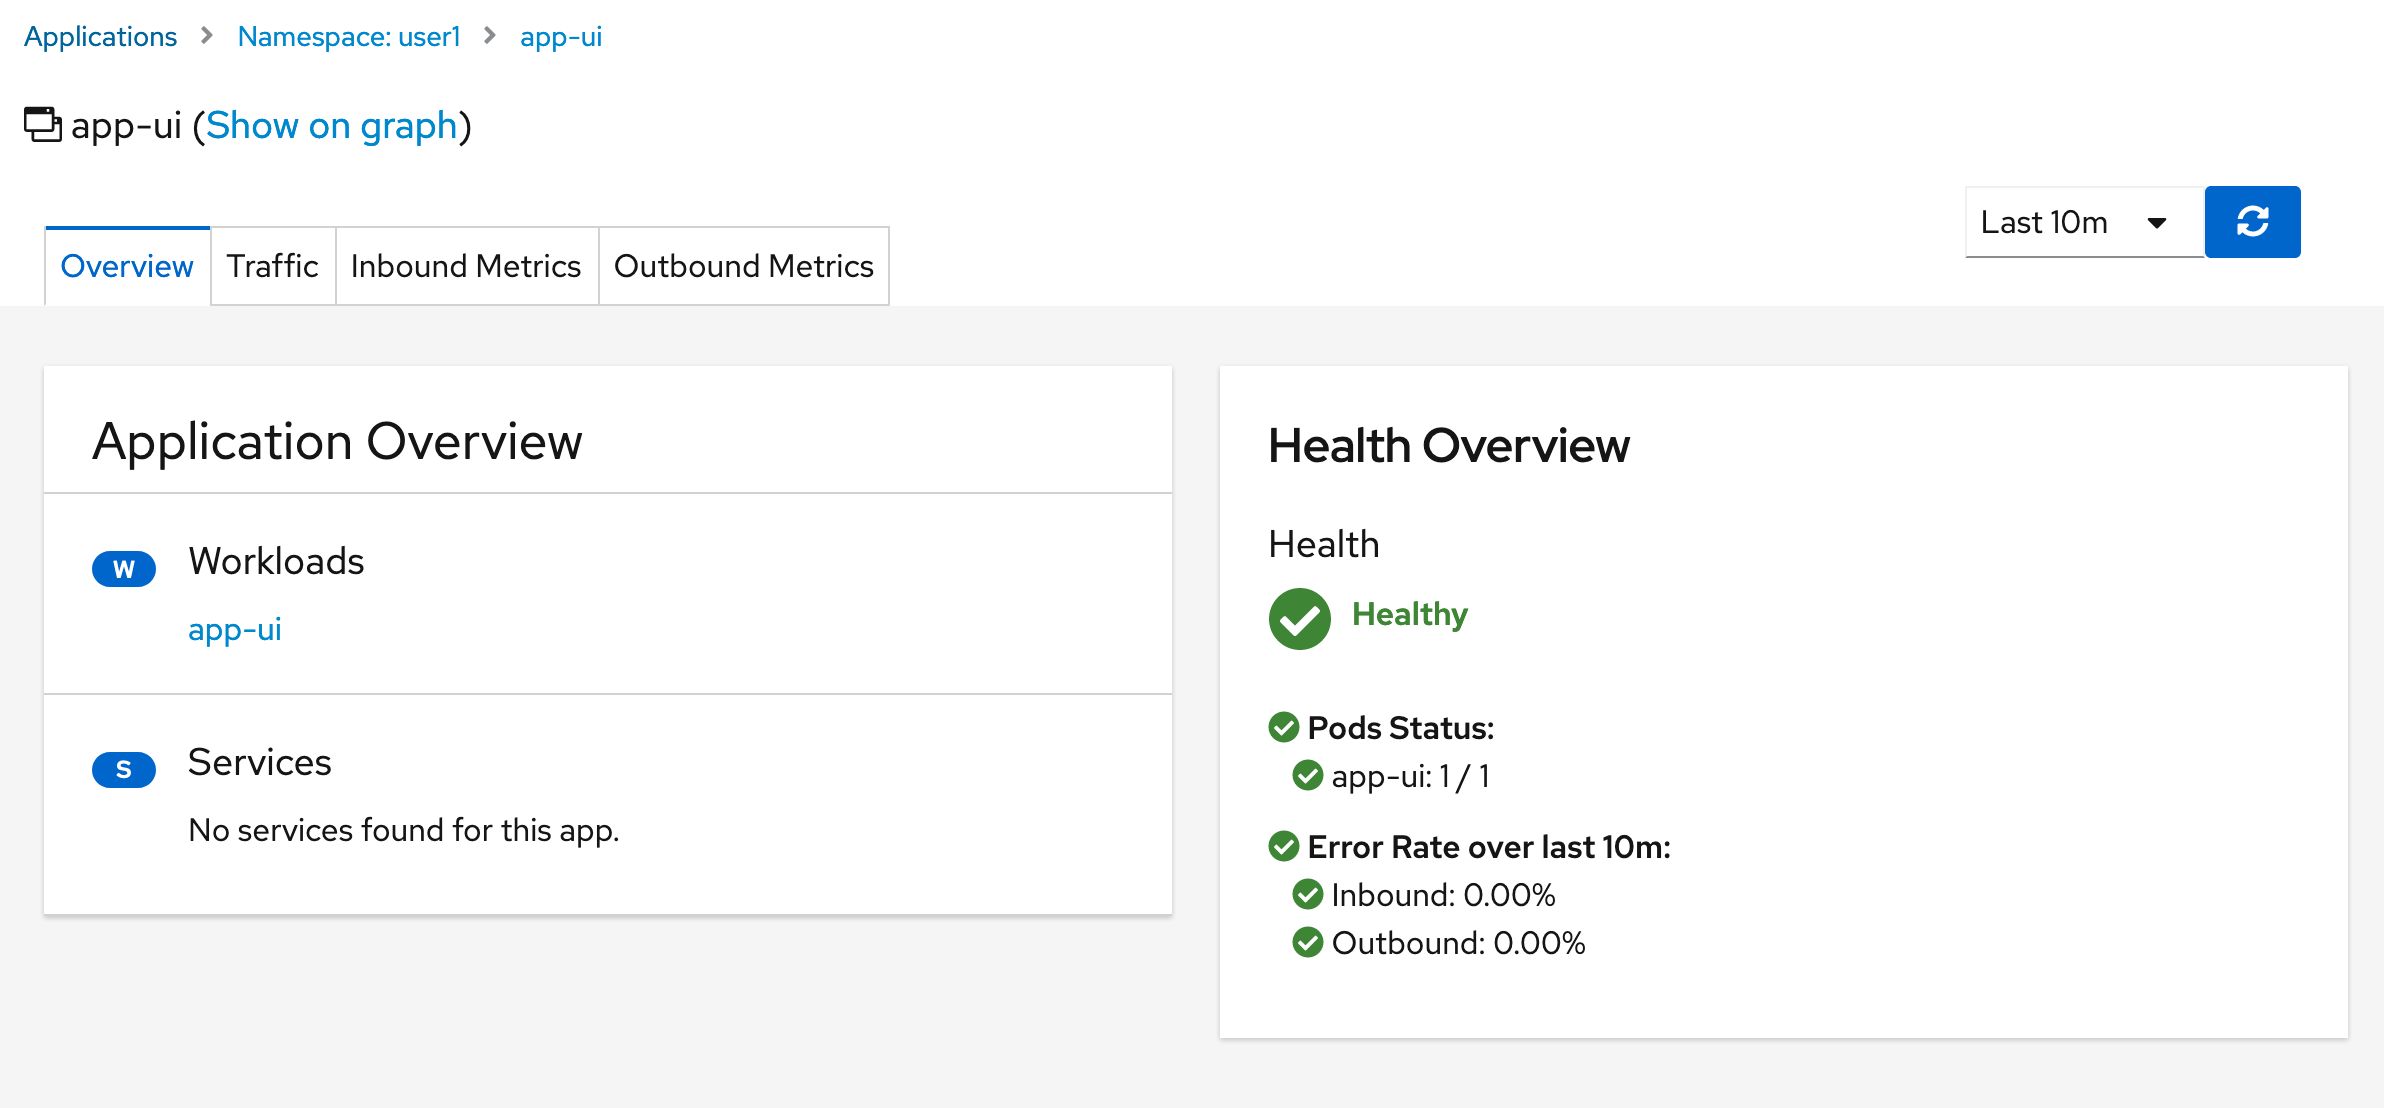
Kiali View of App UI
You should see the ‘Health’ of that microservice.
Navigate to the 'Traffic' tab and you should see the inbound and outbound calls made from that microservice.
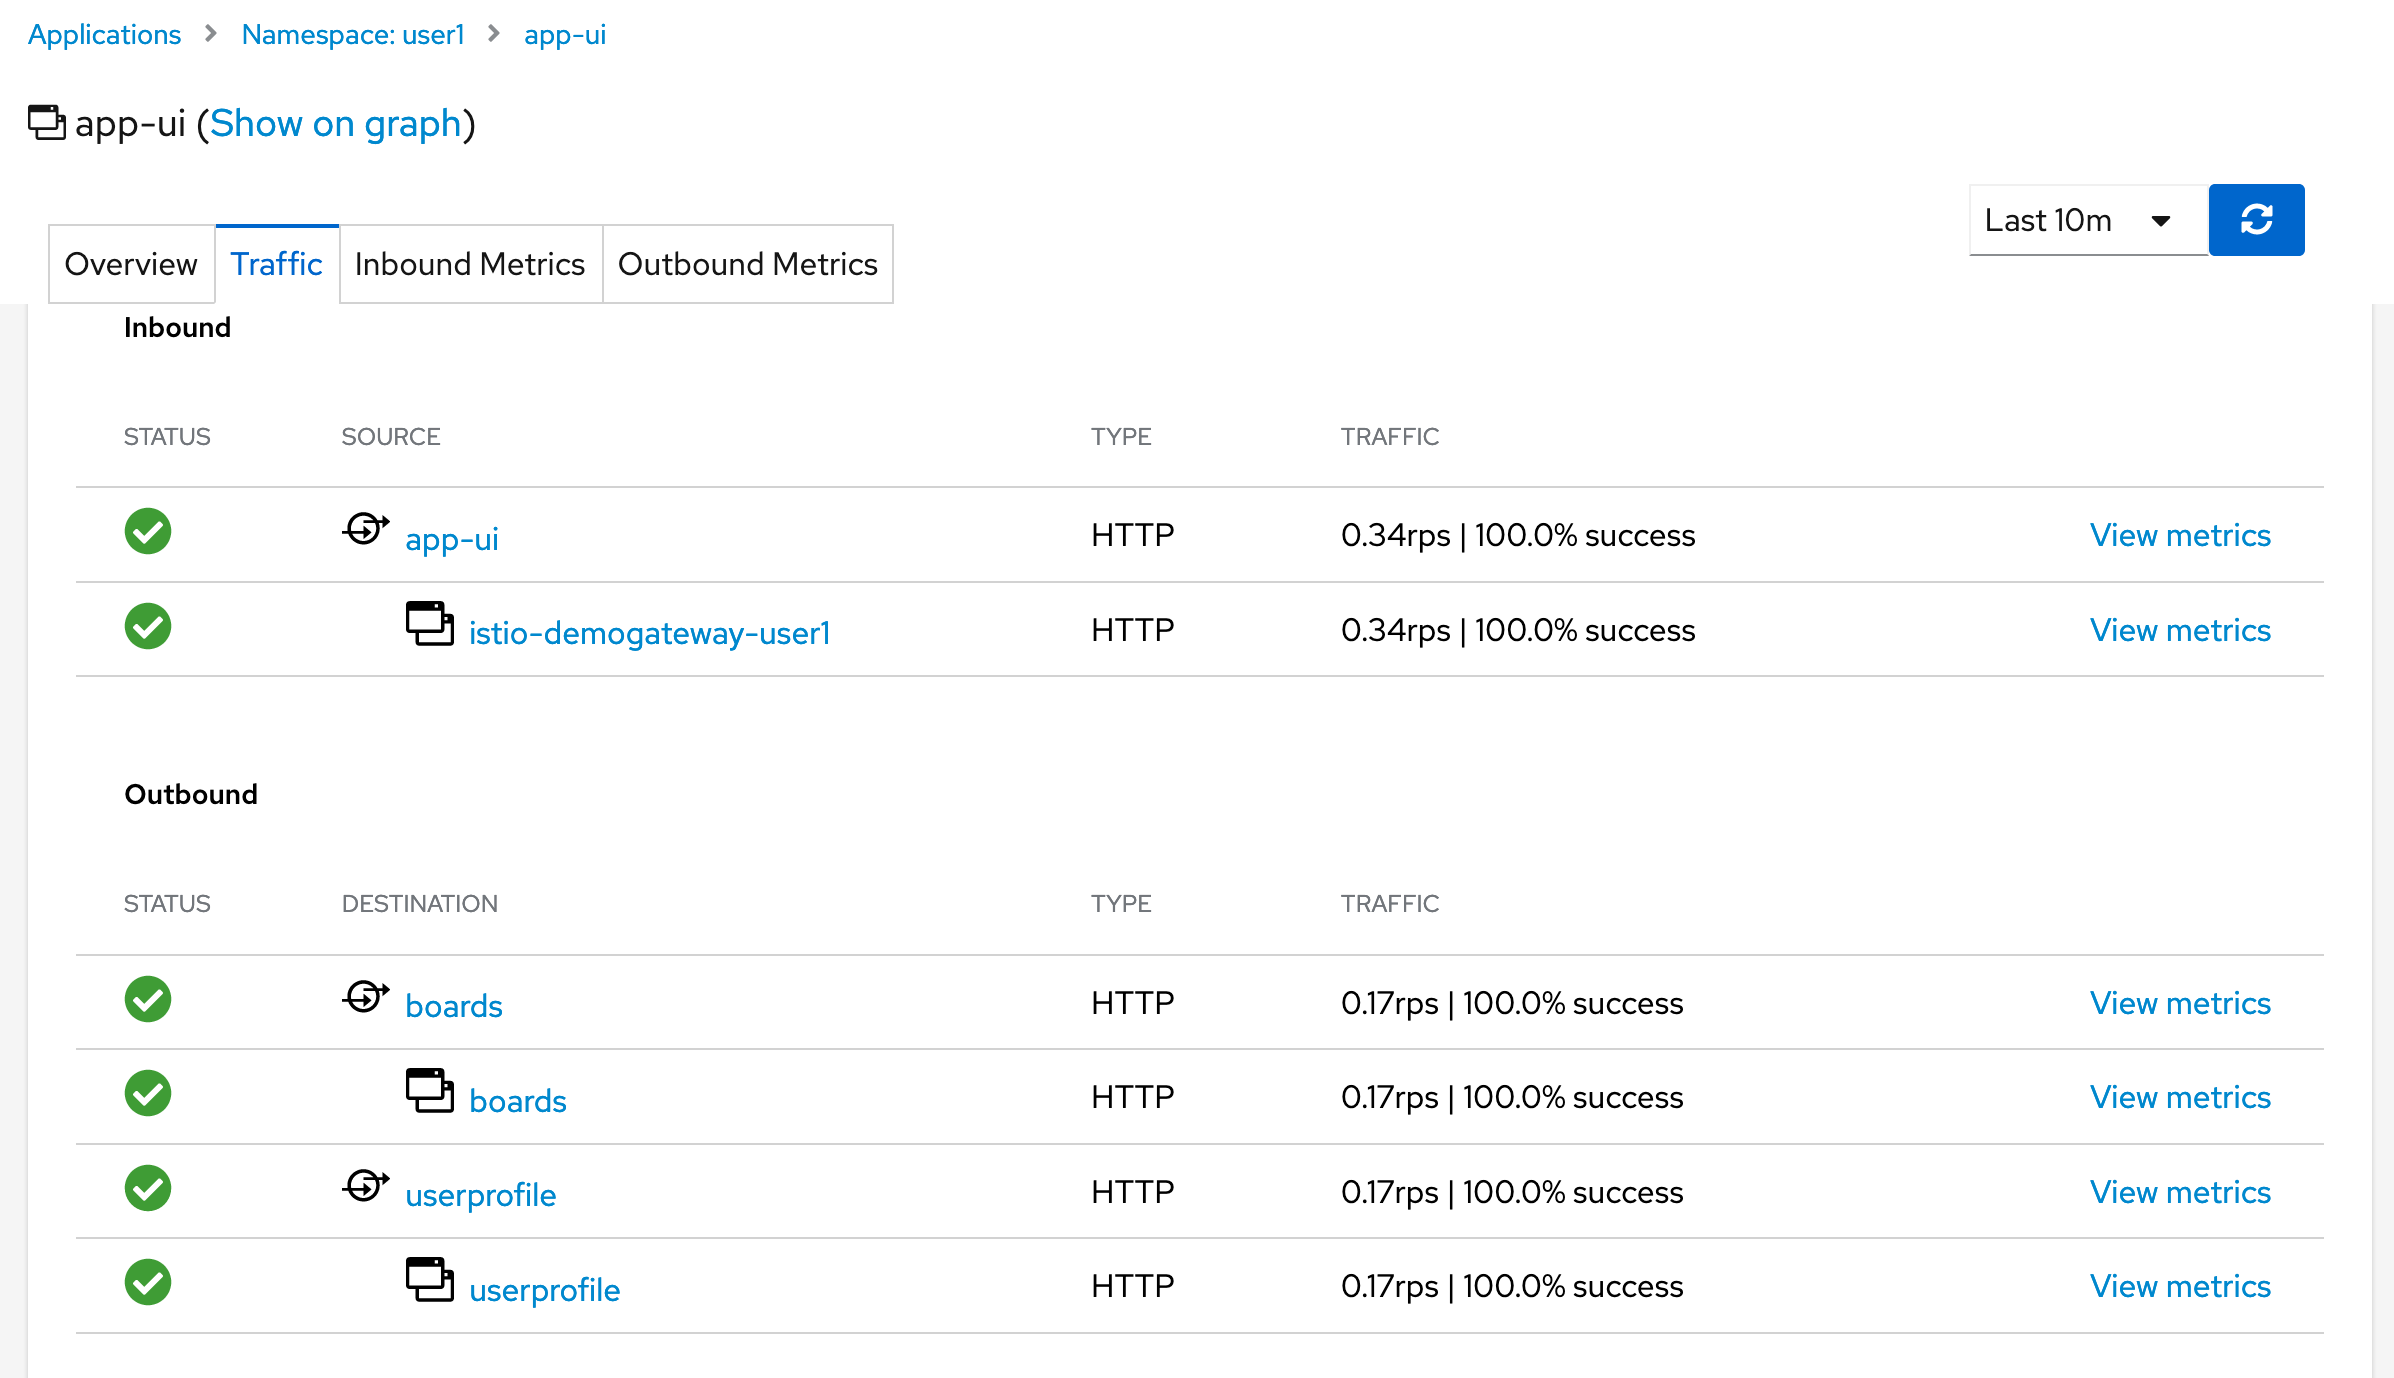
Kiali View of Inbound and Outbound Traffic to App UI
Keep the Kiali console opened in a tab in your browser. You will use Kiali throughout the remainder of the labs.
Workshop Details
| Domain |
|
|
| Workshop | ||
| Student ID |
Workshop Details
| Domain |
|
|
| Workshop | ||
| Student ID |