Distributed Tracing with Jaeger
Jaeger is a distributed tracing tool that lets you trace requests as they flow through your service mesh. This is incredibly useful for debugging performance issues in your microservices architecture.
Explore Jaeger
First, let’s explore the Jaeger user interface.
Open the Jaeger console. Retrieve the endpoint for Jaeger:
JAEGER_CONSOLE=$(oc get route jaeger -n istio-system --template='https://{{.spec.host}}')
echo $JAEGER_CONSOLE
Click 'Allow selected permissions' if prompted to authorized access.
Navigate to this URL in the browser. Login with the same credentials you were provided to access OpenShift.
Once logged in, you should be presented with the Jaeger console:
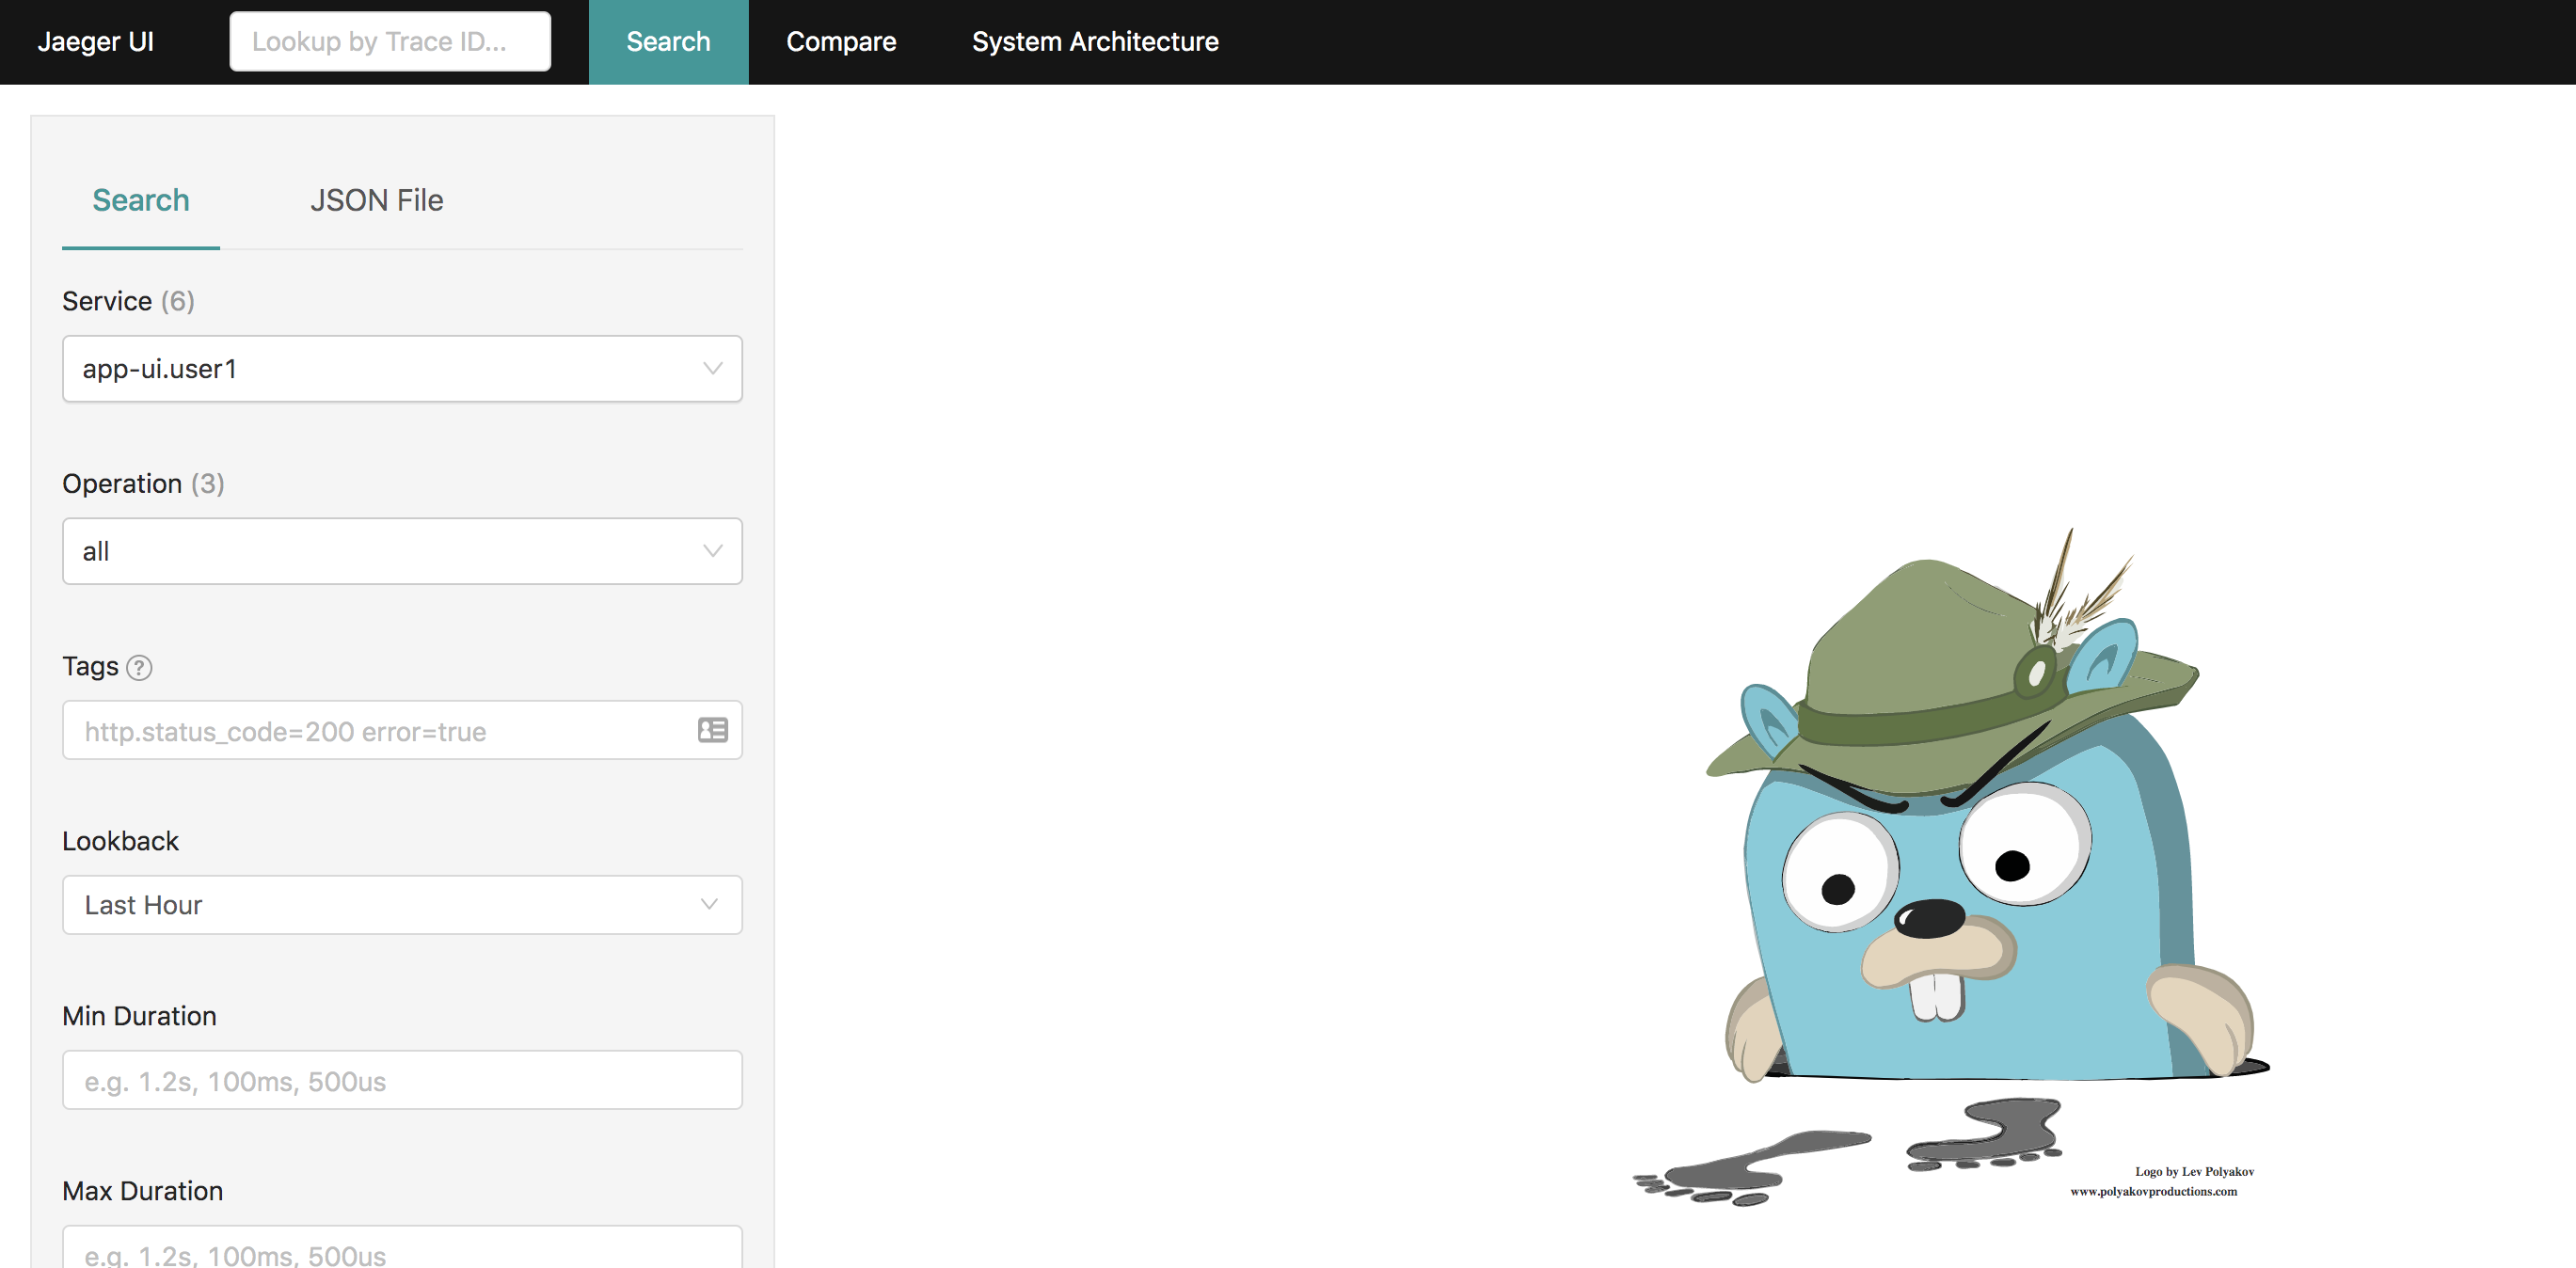
Jaeger Welcome
You need to create traces to explore how requests flow in your mesh.
Send load to the application user interface:
for ((i=1;i<=100;i++)); do curl -s -o /dev/null $GATEWAY_URL; done
Let's inspect the traces.
On the left bar under 'Search', select 'app-ui.userYOUR# ' for 'Service' and 'boards-userYOUR# .svc.cluster.local' for 'Operation'.
It should look like this:
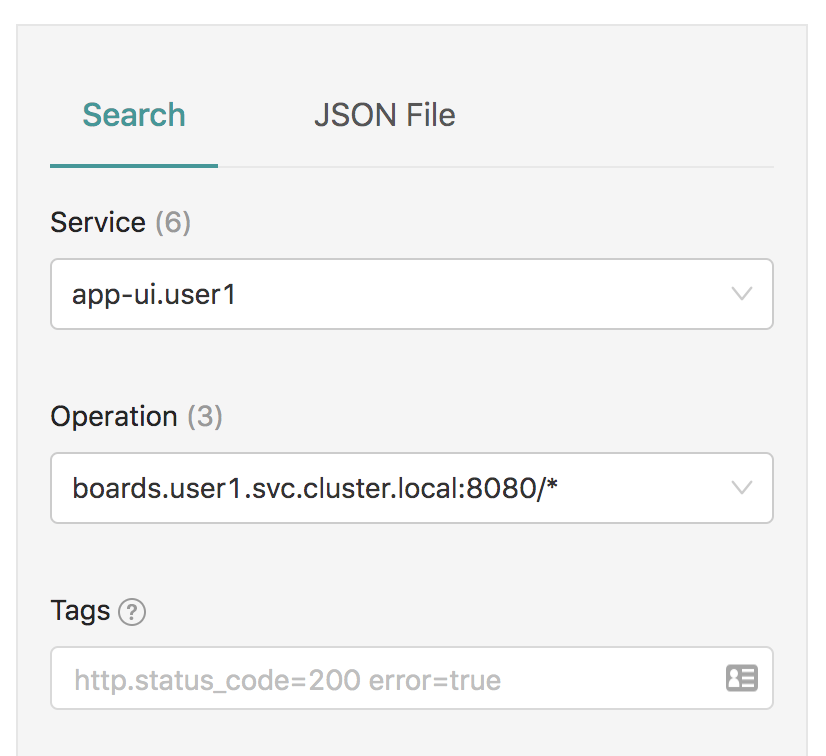
Search for Traces to Boards Service
Click the 'Find Traces' button and Jaeger should reload with traces to the Boards service.
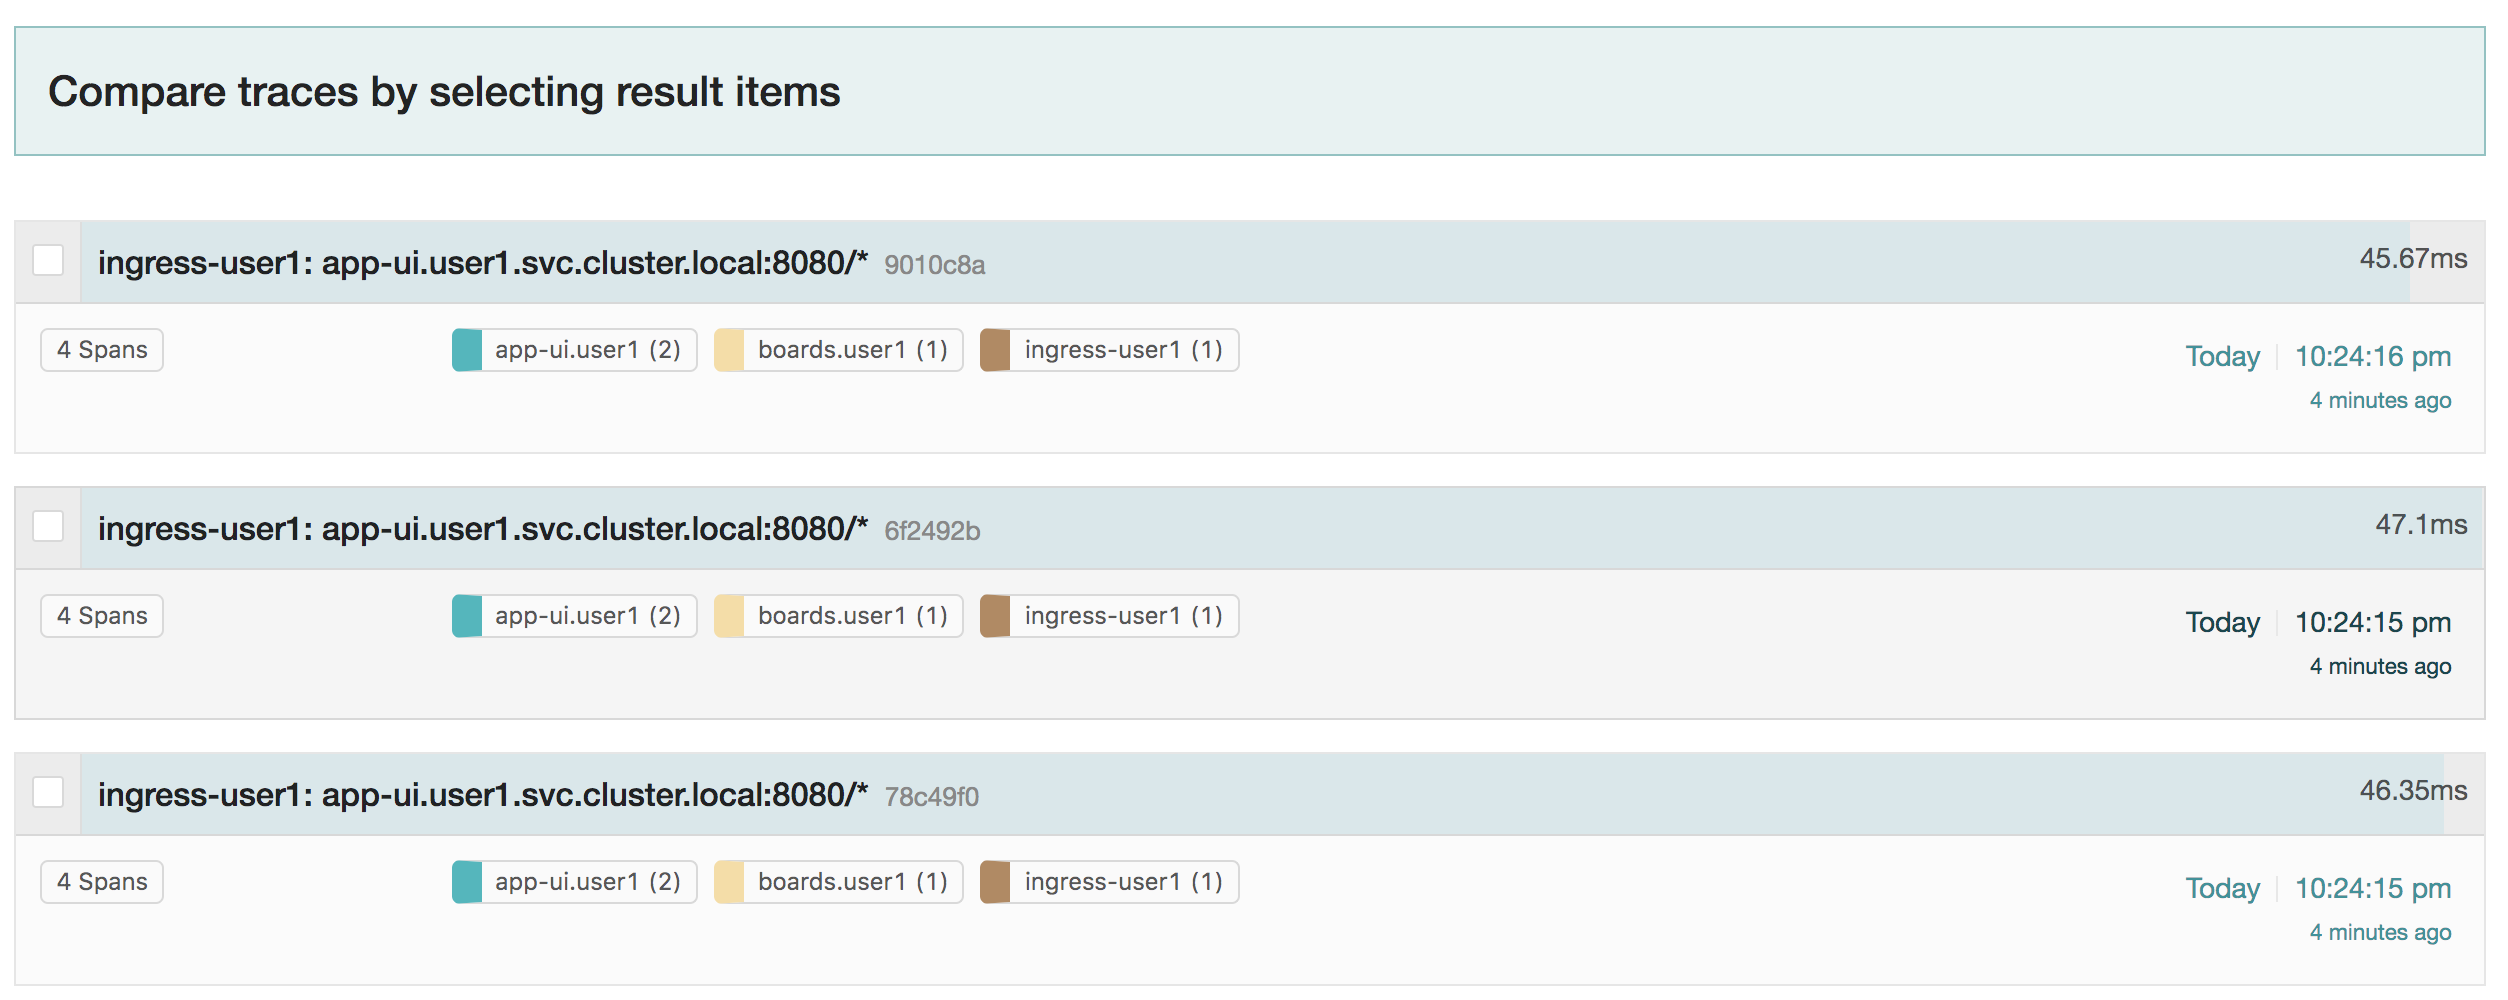
Traces to Boards Service
Select one of these traces.
You’ll notice the information includes ‘Duration’ and ‘Total Spans’. ‘Duration’ indicates the total time it took to send and receive a response for this trace. ‘Total Spans’ indicates the number of spans; each span represents a unit of work executed for this trace. In the example below, ‘app-ui’ took 9.52ms in which 5.14ms was spent on calling the boards service. The boards service itself took 3.56ms to execute before returning a response.
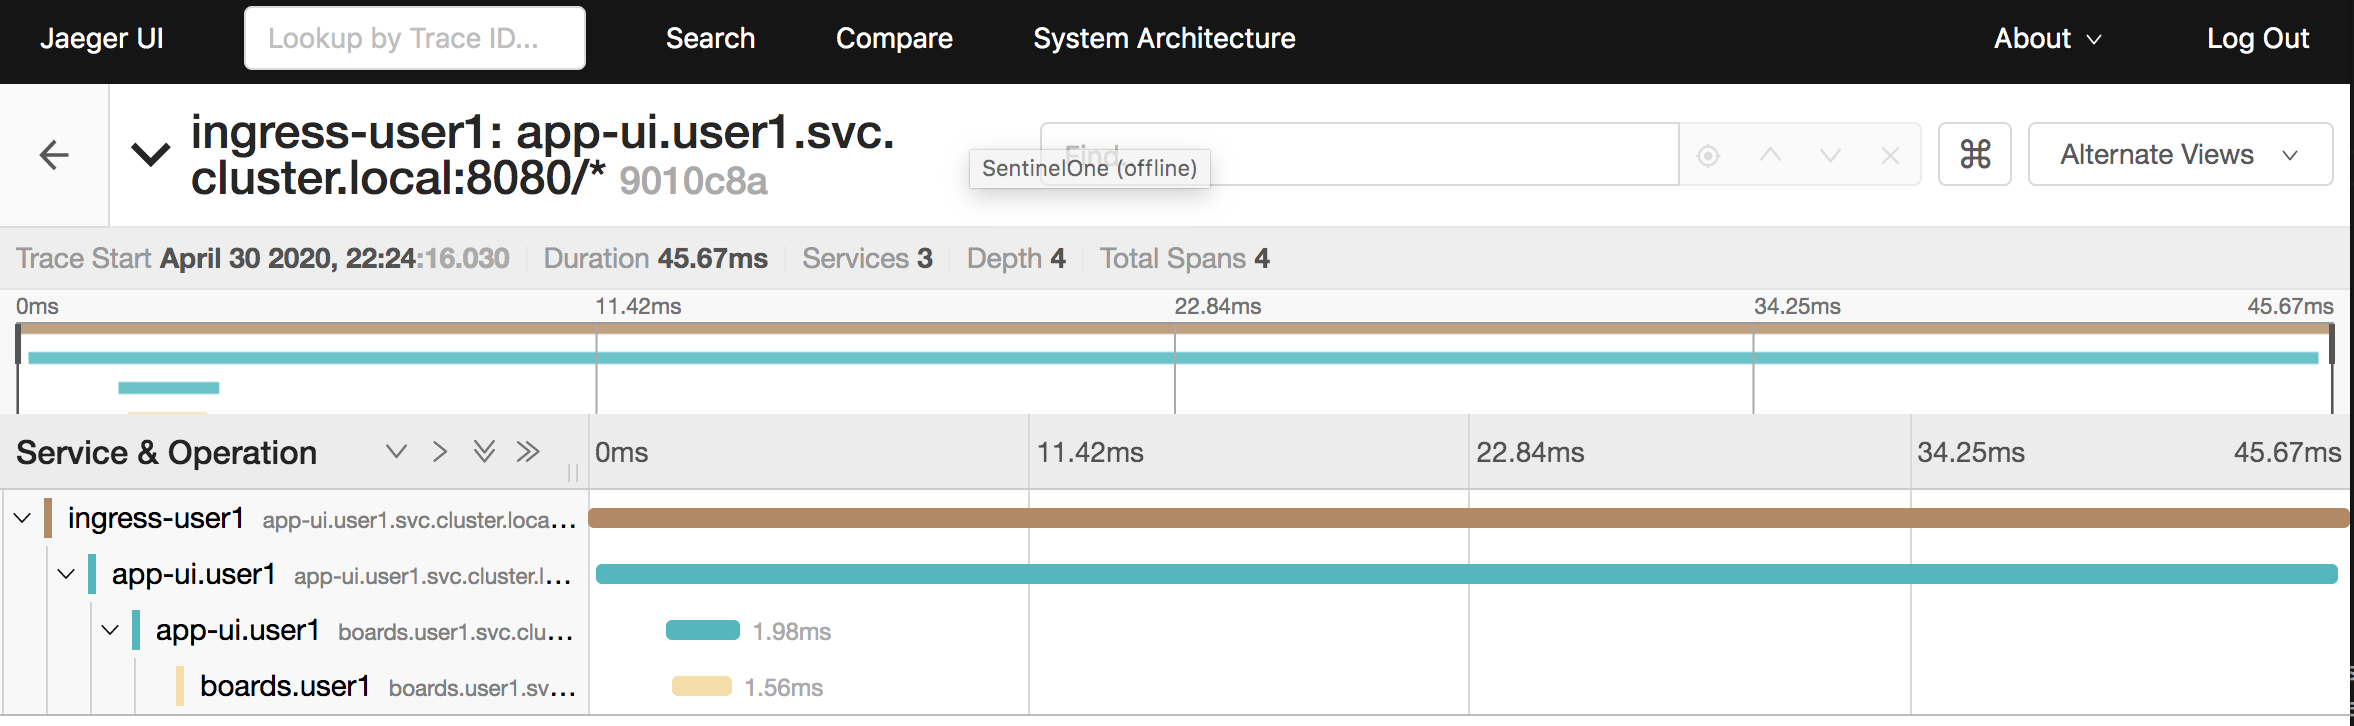
Boards Service Example
You can inspect more information about each span by clicking on the span itself.
Expand the two lowest spans in the tree like this:
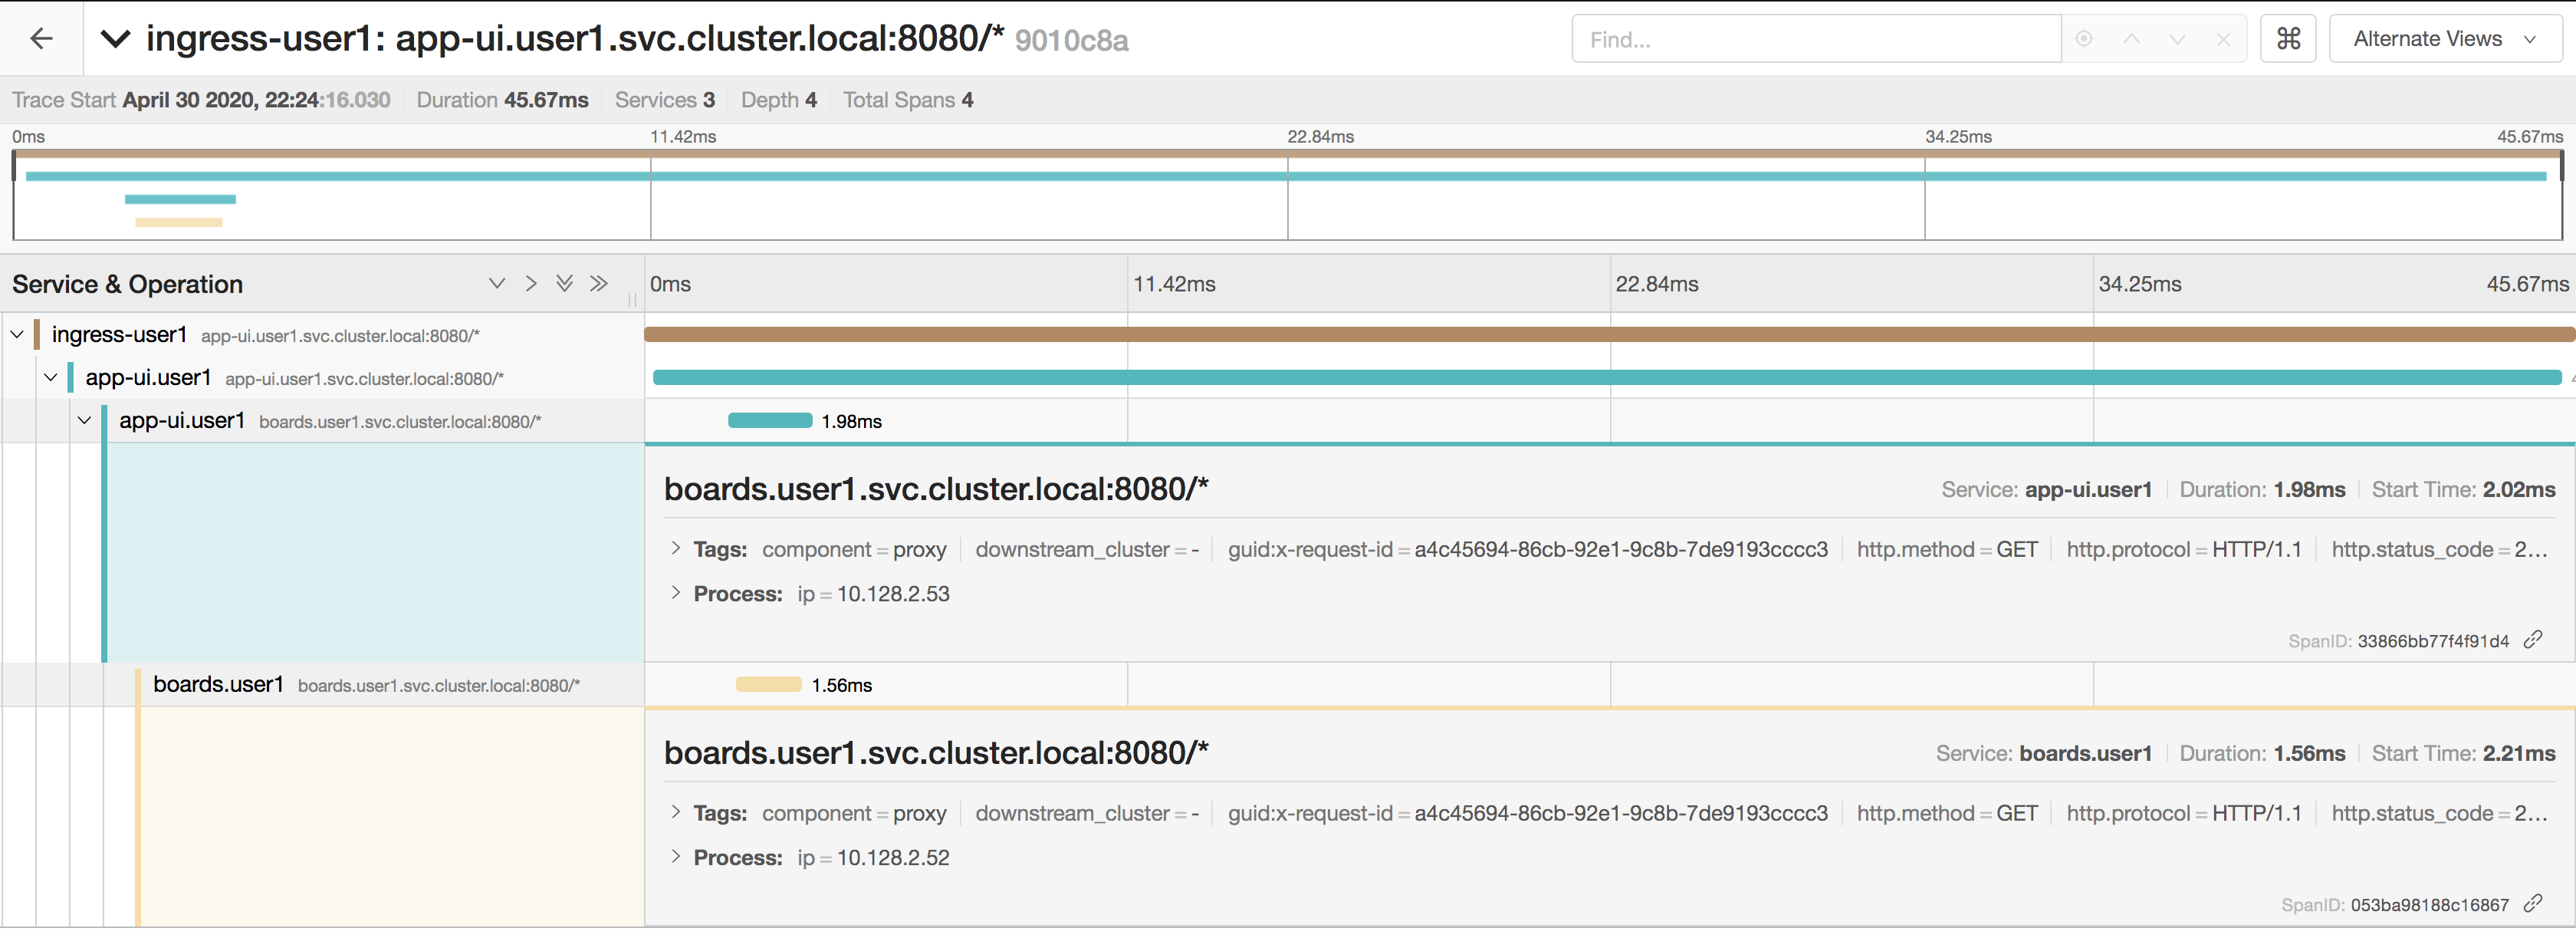
Boards Service Expanded
Each span gives you the duration of the span and its start time relative to the total duration. Under ‘Tags’, you can see additional information such as the HTTP URL, method, and response. Finally, you can see the actual IPs of the process that executed this span. You can verify the IPs match the pods that served this traffic.
Verify the app-ui pod IP:
oc get pods -l deploymentconfig=app-ui -o jsonpath='{.items[*].status.podIP}{"\n"}'
Verify the boards pod IP:
oc get pods -l deploymentconfig=boards -o jsonpath='{.items[*].status.podIP}{"\n"}'
The pod IPs should match to the process IPs in the spans you expanded.
Debug User Profile
Let’s use what we learned to debug the performance of the user profile service.
Send load to the user profile service:
for ((i=1;i<=5;i++)); do curl -s -o /dev/null $GATEWAY_URL/profile; done
Wait for this to complete as the profile service is slow.
Inspect the traces.
On the left bar under 'Search', select 'app-ui.userYOUR# ' for 'Service' and 'userprofile-userYOUR# .svc.cluster.local' for 'Operation'.
Select 'Find Traces' and Jaeger should reload with traces to the user profile service.
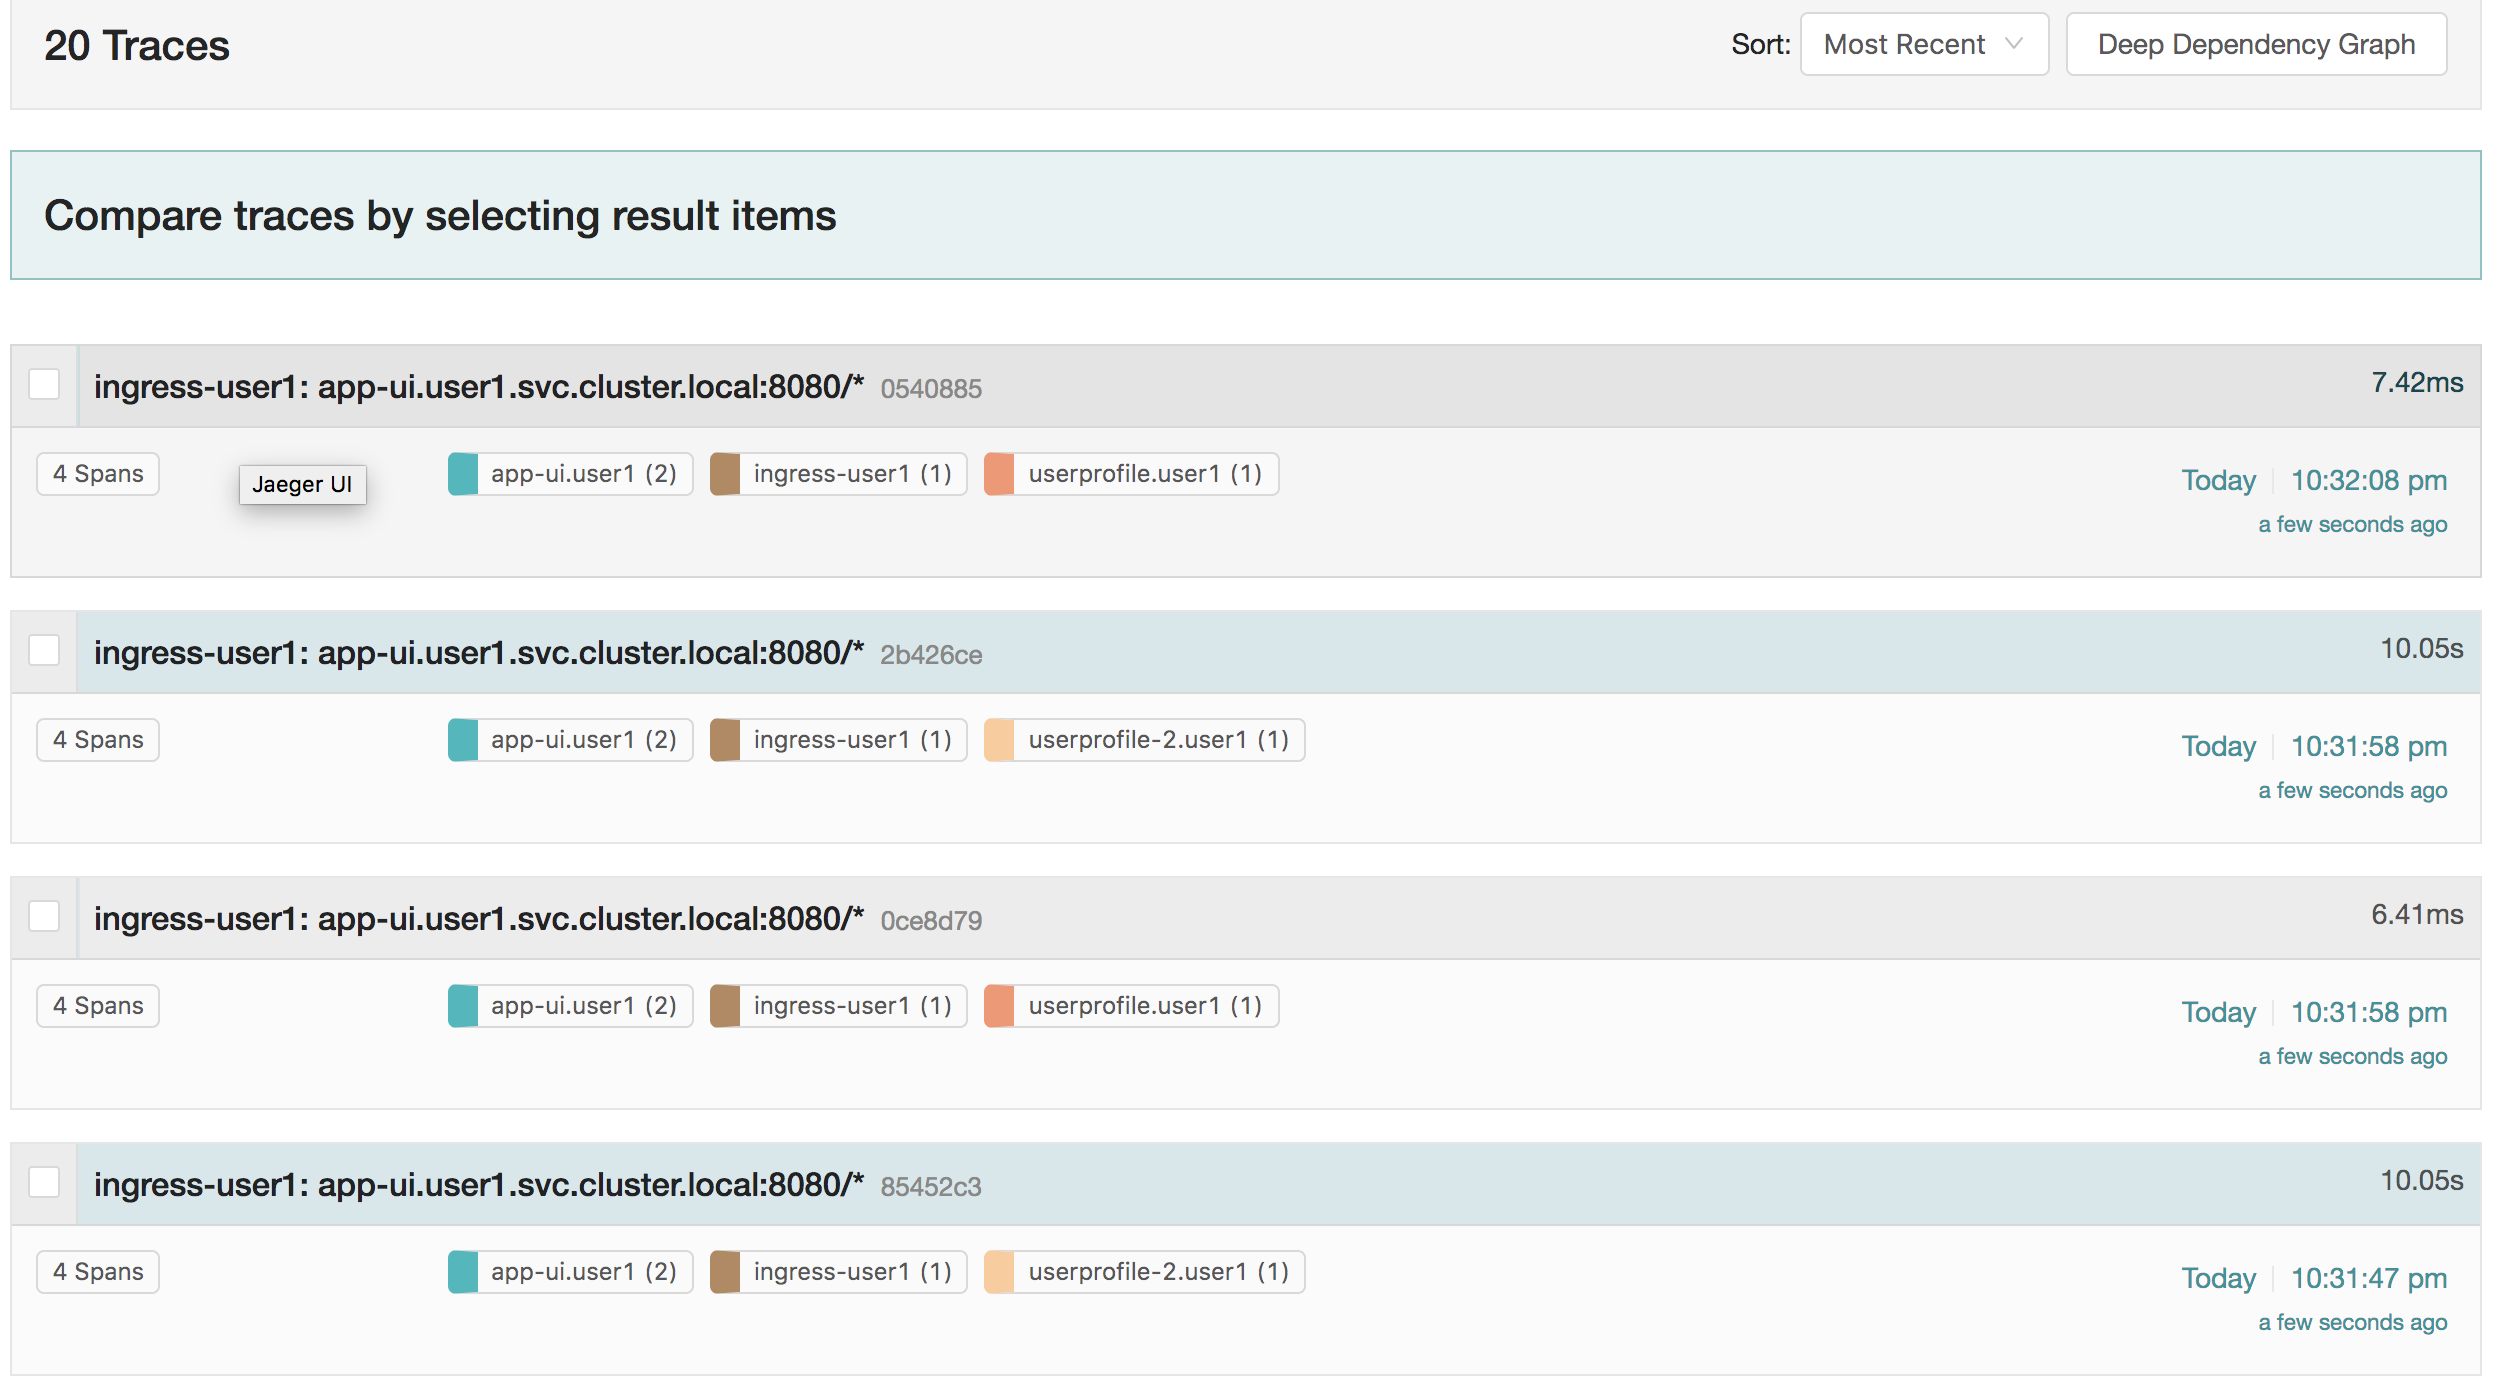
Traces to User Profile Service
Notice that some of these traces are fast (on the order of ms) and some are slow (about 10s).
Select one of the fast traces to start, and expand the lowest span.
Your view should look like this:
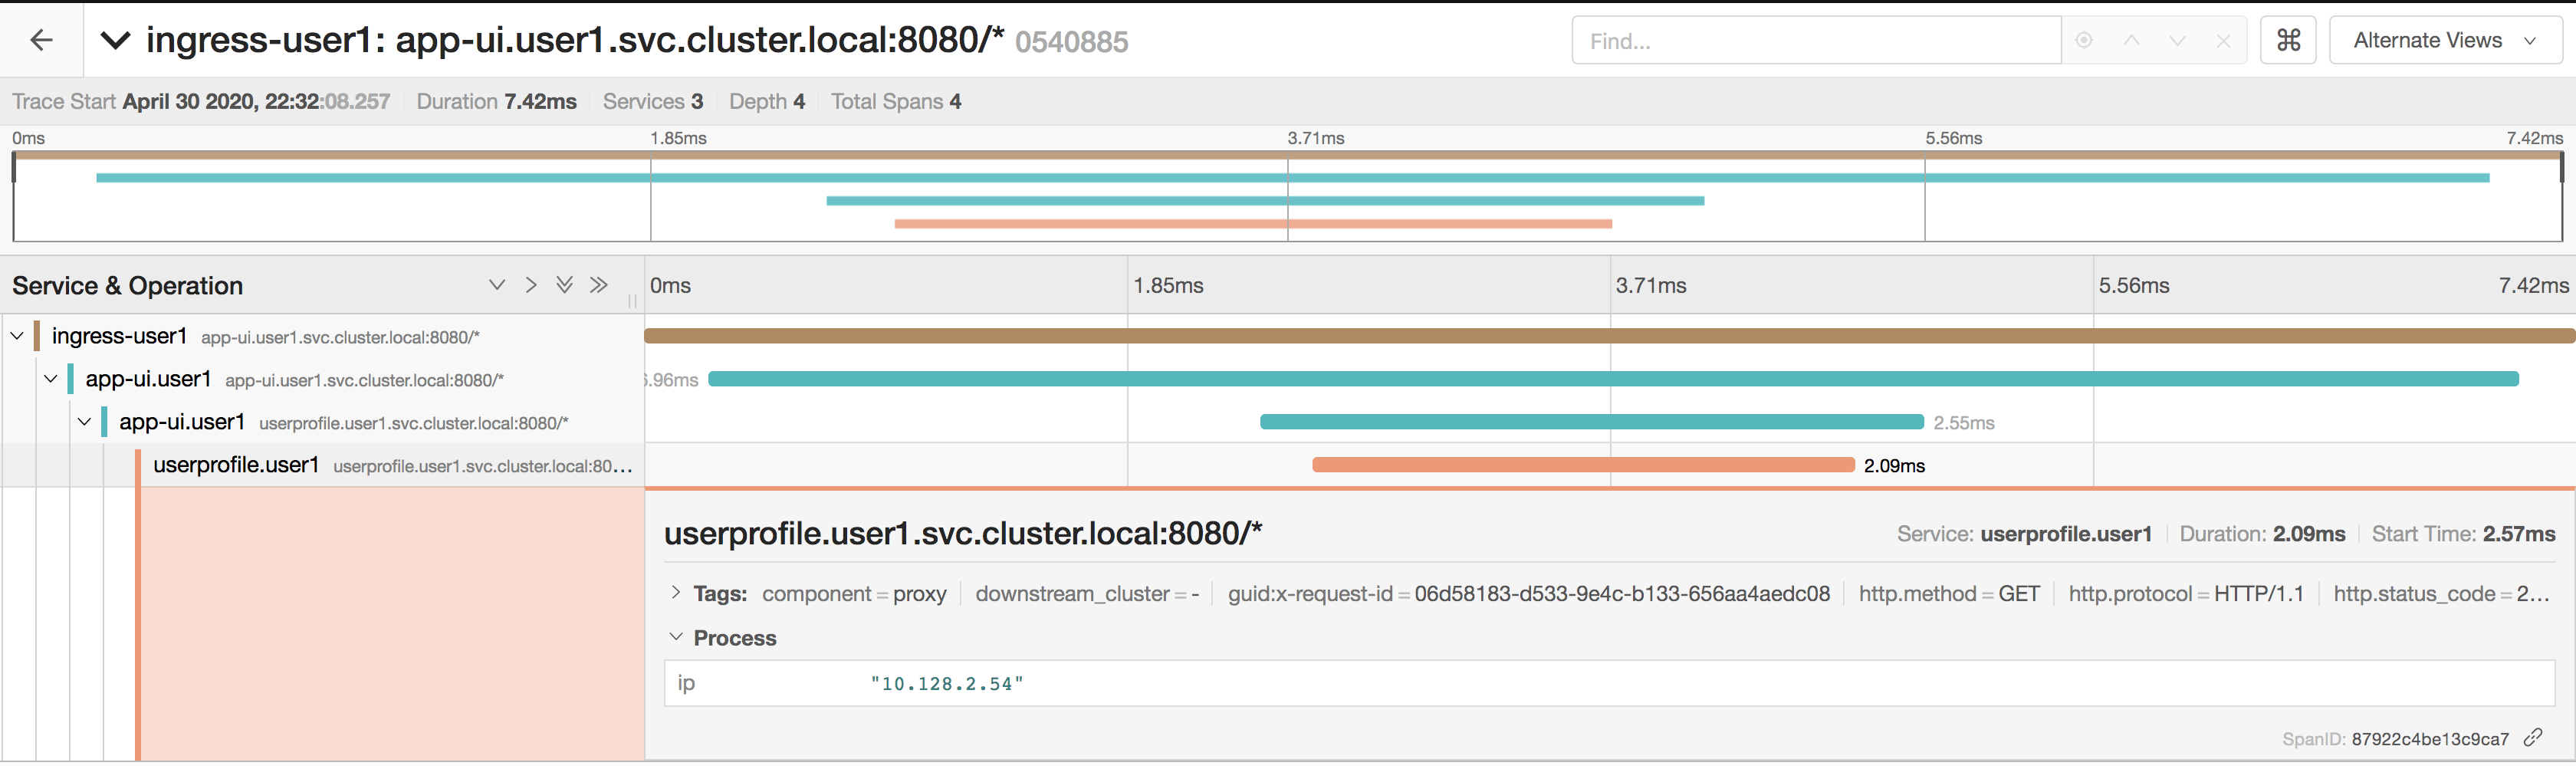
User Profile Fast Service
In the example above, it took a total of 13.48ms for the trace to complete. The user profile service itself took 3.5ms to execute and return a response. You can verify the pod that served this request was the version 1 user profile service.
Verify the userprofile-v1 pod IP:
oc get pods -l deploymentconfig=userprofile,version=1.0 -o jsonpath='{.items[*].status.podIP}{"\n"}'
The pod IP should match to the process IP in the span you expanded.
Now, select one of the slow traces and expand the lowest span.
Your view should look like this:
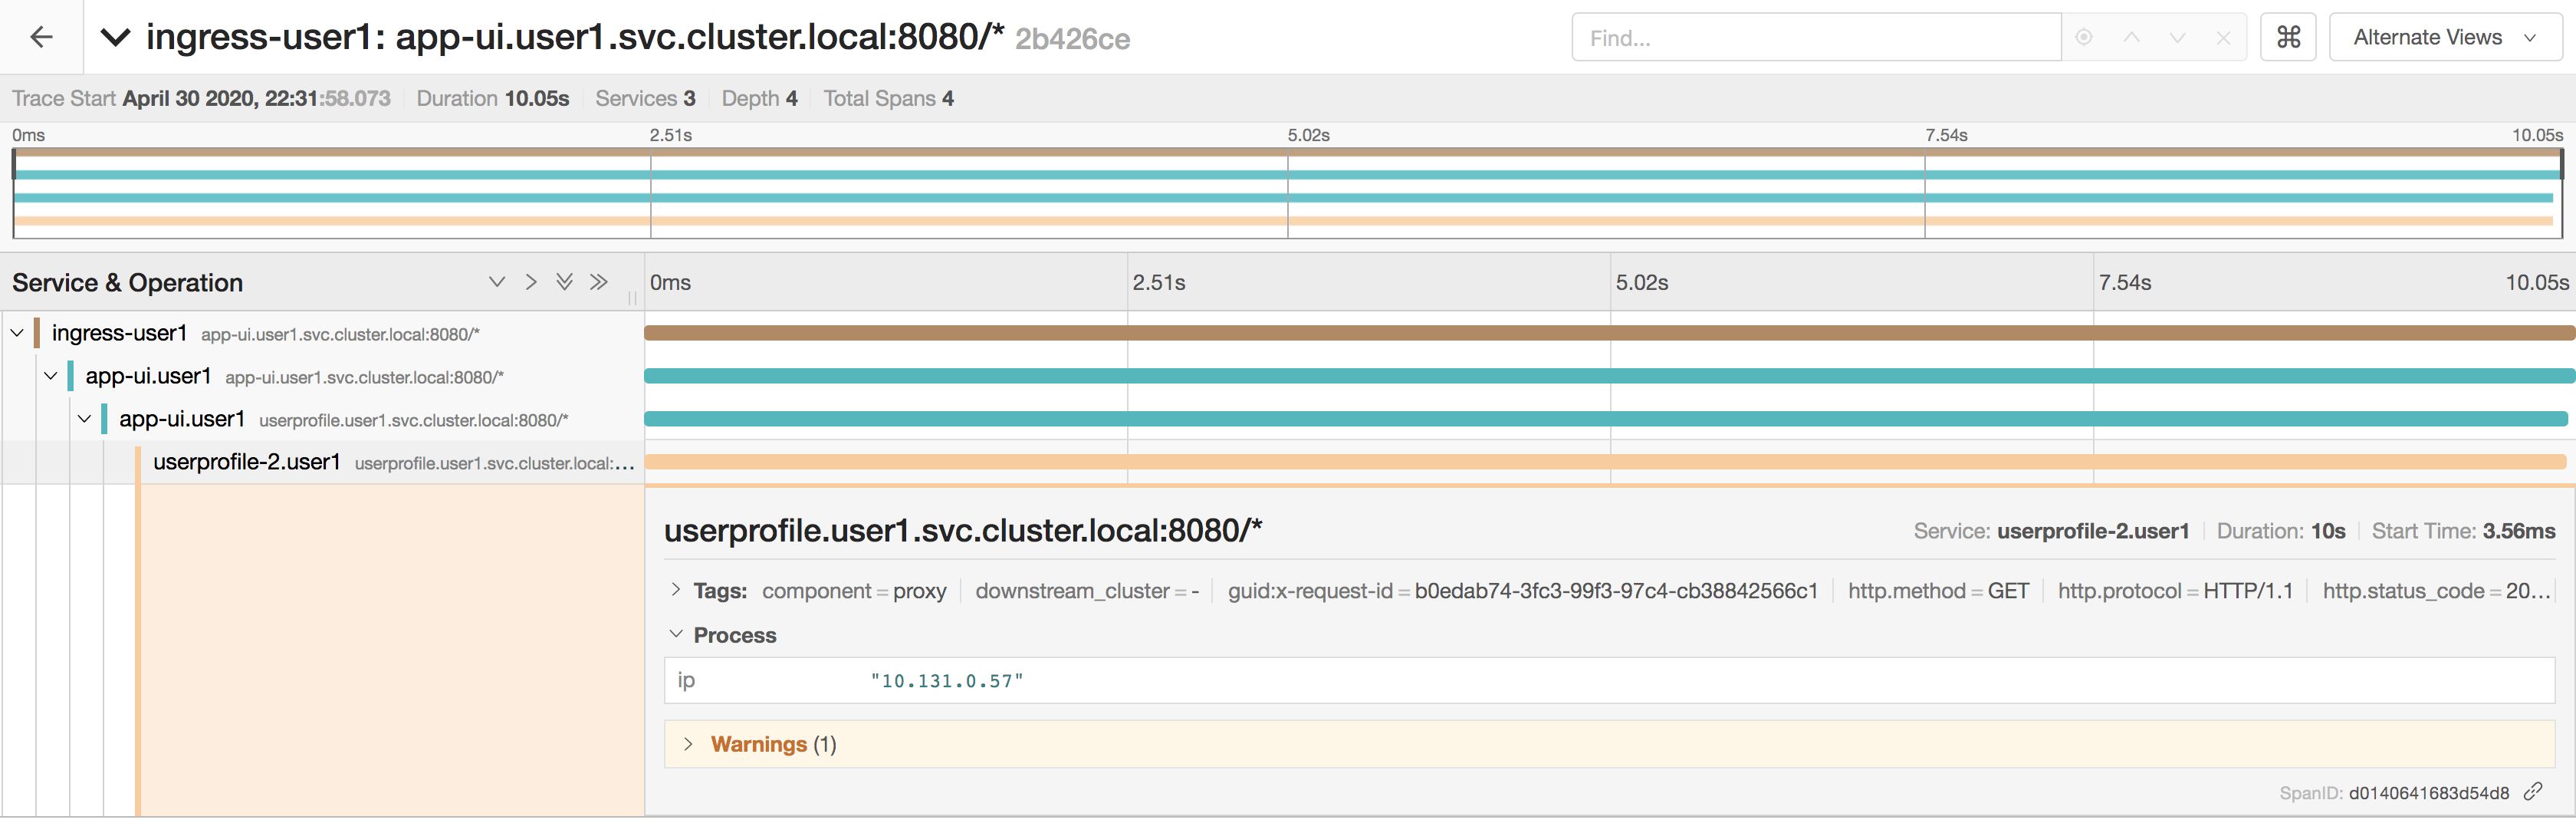
User Profile Slow Service
In this view, you can easily see that the total time of the request was spent by the userprofile service itself. In the example above, it started execution at 5:23ms and took 10 seconds to complete. You can further verify the pod that served this request was the version 2 user profile service.
Verify the userprofile-v2 pod IP:
oc get pods -l deploymentconfig=userprofile,version=2.0 -o jsonpath='{.items[*].status.podIP}{"\n"}'
The pod IP should match to the process IP in the span you expanded.
At this point, it is really clear that there is a performance issue directly in the version 2 source. Although the example was simplistic, distributed tracing is incredibly helpful when you have a complicated network of service calls in your mesh.
Workshop Details
| Domain |
|
|
| Workshop | ||
| Student ID |
Workshop Details
| Domain |
|
|
| Workshop | ||
| Student ID |