https://node-0.example.redhatgov.io:9090Exercise Description
To get started, we will take a tour of the web console. The web console (called cockpit) will be your primary interactive interface to RHEL. The console has a number of functions that enable you to manage most aspects of the installation.
Connect to your personal lab environment. Ensure that the information in the footer of the page is correctly filled out and the URL for your environment should show up below
Section 1: Overview of the web console
Here is a quick overview of all the available modules. Click through each of these menu options to see the information discussed:
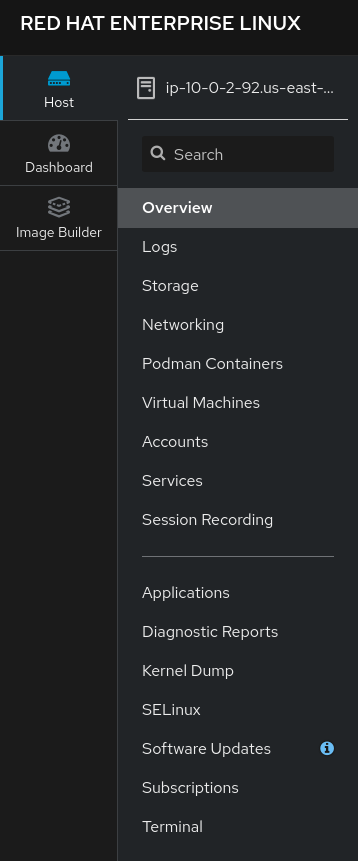
Figure 1: Web console functions
The various functional sections can be seen in Figure 1, and are:
- Overview
-
Contains an overview of the system, including metadata and health graphs
- Logs
-
Displays current journald logs from all services
- Storage
-
Displays storage activity graphs, and logs. Enables the management of NFS mounts, RAID devices, volume groups, VDO (deduplication) devices, and iSCSI targets
- Networking
-
Displays network activity, logs, and allows firewall and network maintenance
- Podman Containers
-
Enables the management of container images and running containers
- Virtual Machines
-
Virtual machines can be created, deleted and controlled
- Accounts
-
Allows for the creation, deletion and configuration of user accounts and ssh keys
- Services
-
Displays all system targets, services, sockets, timers and paths, as managed by systemd, the root process
- Session Recording
-
Manages recorded sessions, and allows for the configuration of session recorder defaults
- Applications
-
Allows for the installation and removal of web console modules
- Diagnostic Reports
-
Creates diagnostic reports used by Red Hat support, also known as SOSreports
- Kernel Dump
-
Manages kernel debugging dumps, created when the system crashes
- SELinux
-
Allows for the setting of SELinux to permissive mode, and shows recent SELinux alerts (AVCs)
- Software Updates
-
Manages automatic package updating, and allows for the manual installation of updates
- Subscriptions
-
Manages subscriptions attached to the host
- Terminal
-
Provides an interactive shell
As you can see, many of the day-to-day management of a RHEL system can be accomplished without touching the terminal. This makes RHEL 8 the easiest-to-live-with release, yet!
Next, let’s proceed to a more detailed examination of each module. Please click through the web console on your host, as you read the explanations, here.
Section 2: System Module
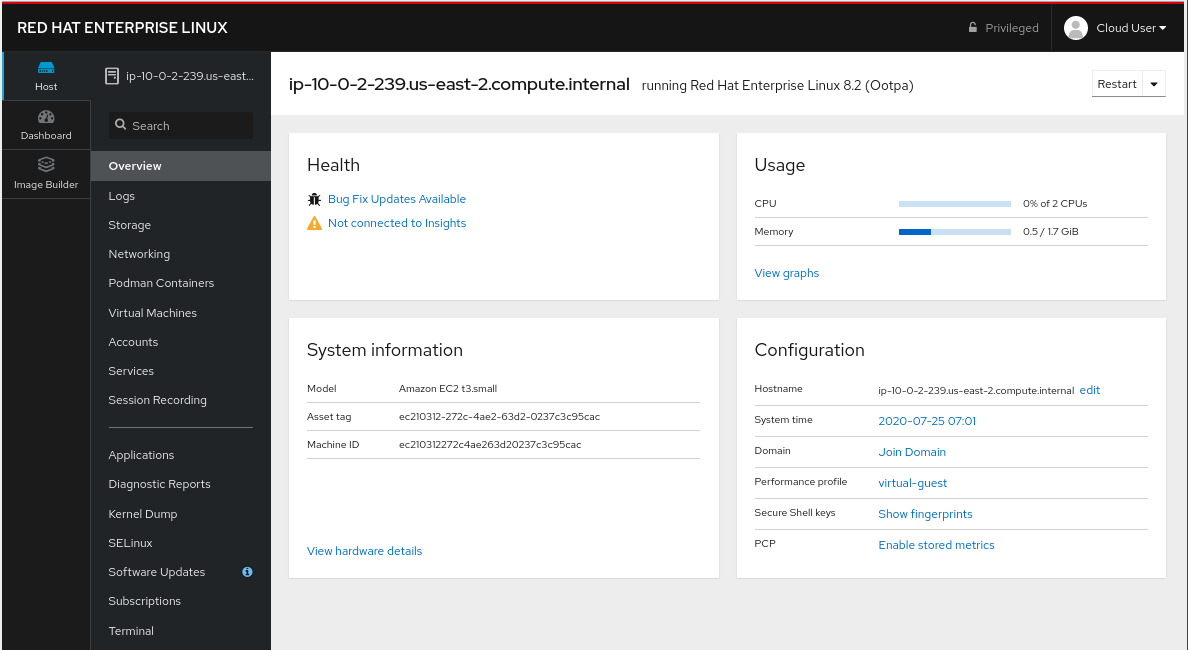
Figure 2: Web Console System Module
The overview module is the main screen that you see, when you first login to the web console. It has four panes:
- Health
-
System health including
-
Bug fixes available
-
Insights information
-
- Usage
-
Snapshot of system performance
-
CPU utilization
-
Memory Utilization
-
Link to additional graphs. Time series of CPU, memory, network and disk I/O
-
- System information
-
information about the hardware of the system (if available)
-
Model of system
-
Asset tag
-
Machine ID
-
Link to more detailed hardware information
-
- Configuration
-
Operating system configuration information, including:
-
hostname
-
system time
-
Domain
-
Performance Profile
-
ssh key fingerprints for all created 'root' keys
-
Toggle to enable or disable storing of metrics.
-
Additionally, there are graphs that show the system’s CPU, memory, disk, and network utilization. Each graph may be enlarged, by clicking its associated link.
Section 3: Logs Module
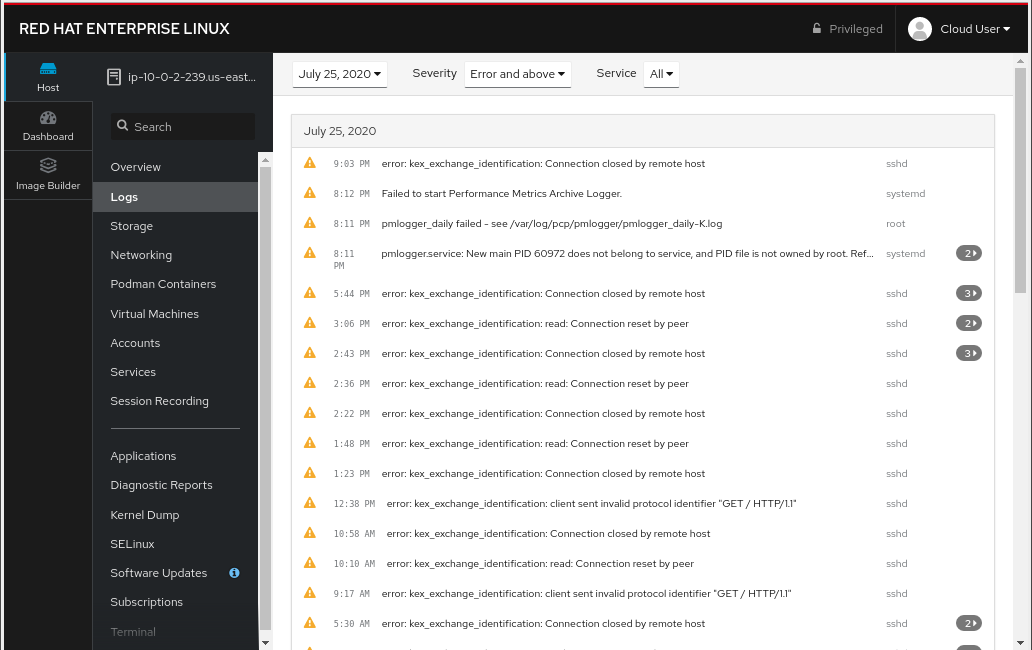
Figure 3: Web Console Logs Module
The logs module provides date-sorted view of recent system log entries. You can change the date or apply basic filters using the pull-down menus at the top of the page.
Section 4: Storage Module
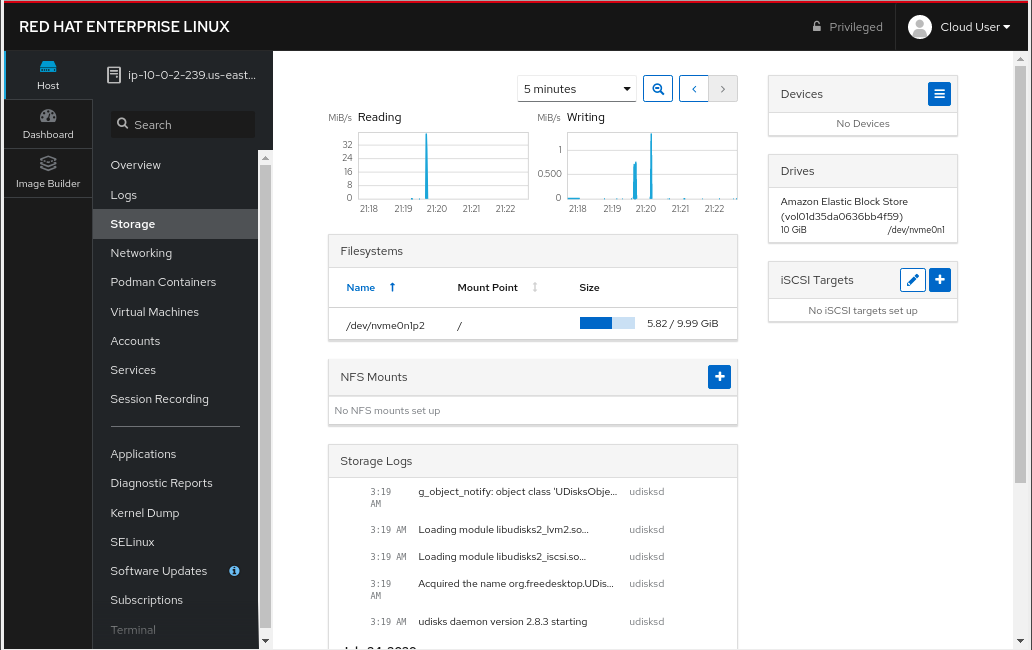
Figure 4: Web Console Storage Module
The storage module provides graphs of current storage performance. It also lists local and network-mounted filesystems, plus recent storage-related log entries.
Section 5: Networking Module
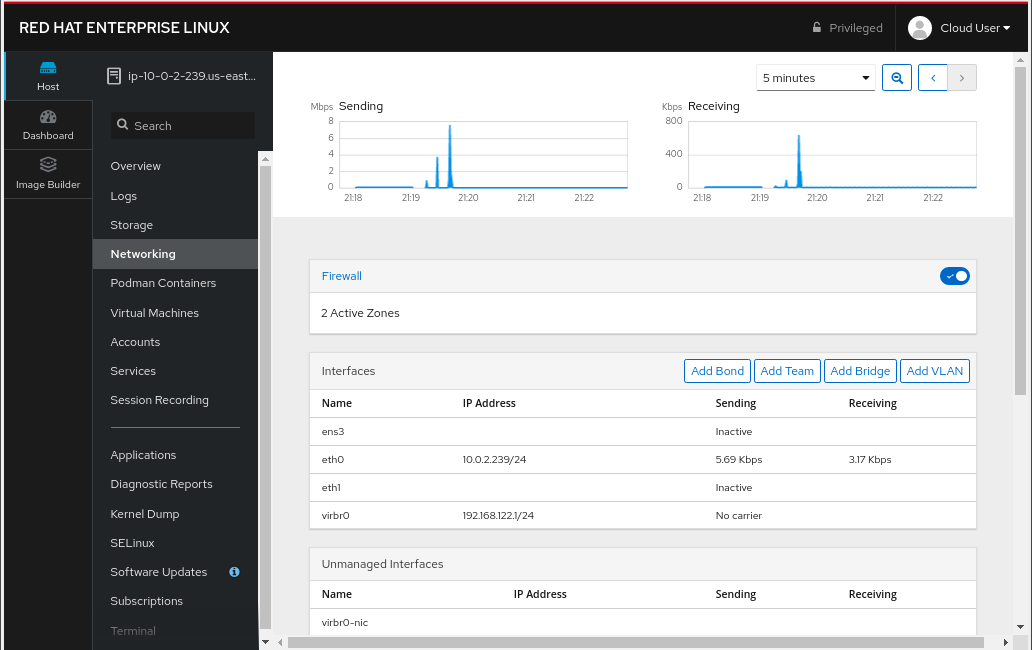
Figure 5: Web Console Networking Module
The network module contains performance graphs similar to the storage module. Additionally, it shows the configuration of your network interfaces, identifies unused interfaces, and provides access to, and control of, the system firewall.
Section 5: Podman Containers Module
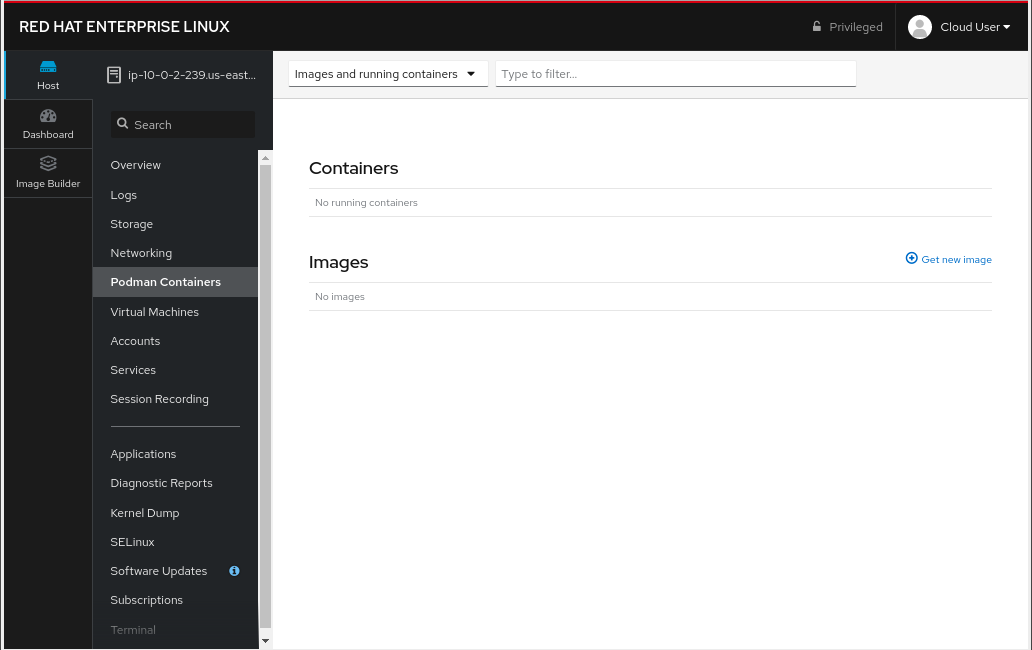
Figure 6: Web Console Podman Containers Module
This module provides control of local podman containers and their corresponding images.
Section 6: Virtual Machines Module
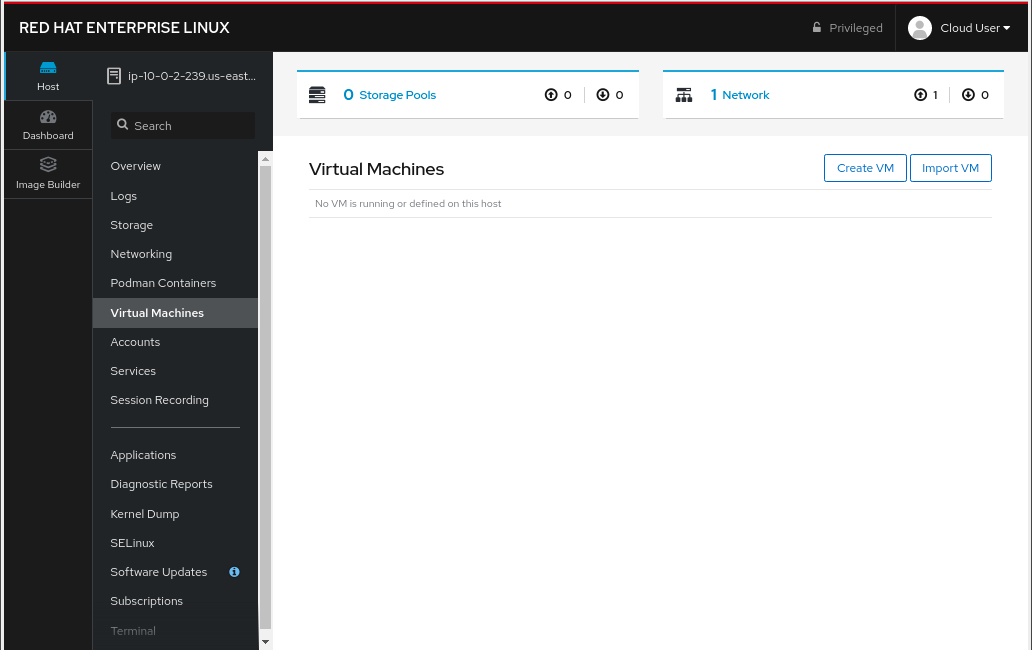
Figure 7: Web Console Virtual Machines Module
The Virtual Machines module allows for the creation, destruction, and management of virtual machines, their storage, and the networks that they are connected to.
Section 7: Accounts Module
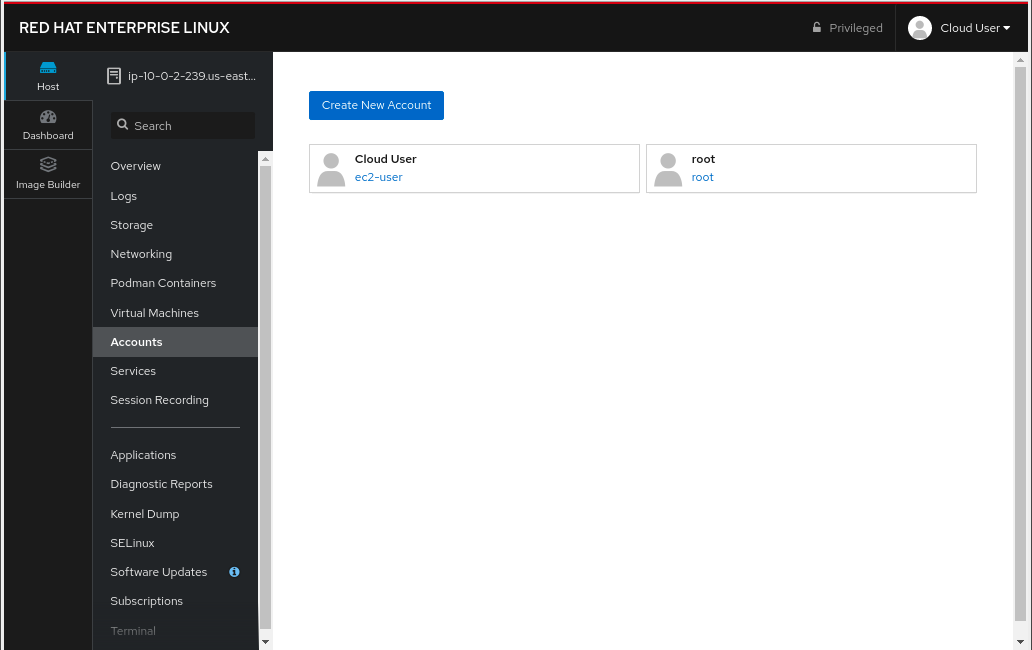
Figure 8: Web Console Accounts Module
The accounts module allows you to create and modify local user accounts.
Section 8: Services Module
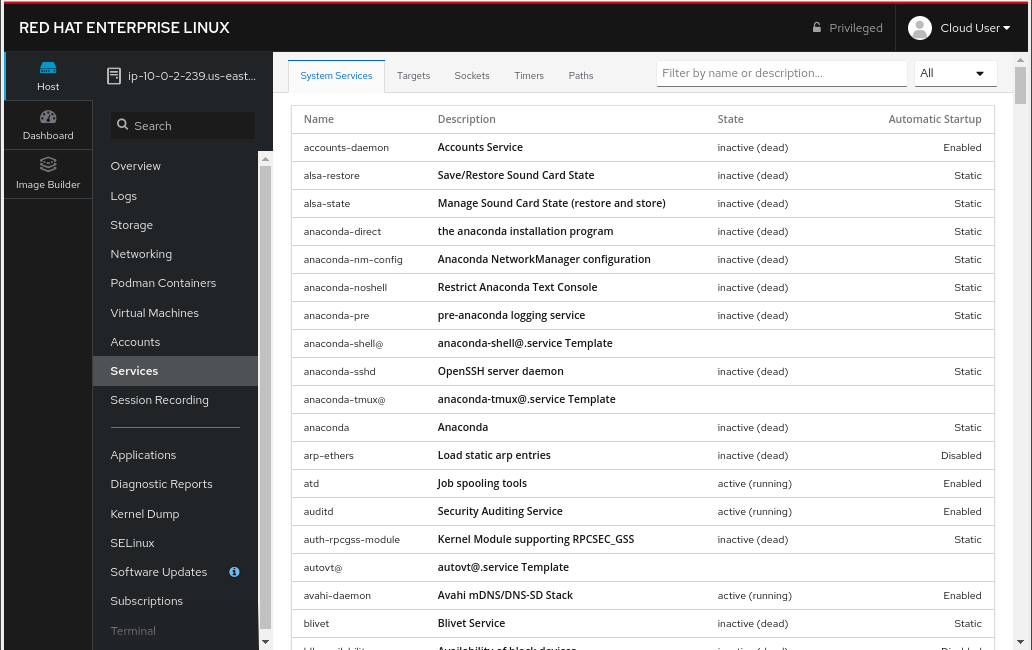
Figure 9: Web Console Services Module
The services module allows basic administration of systemd objects, including system services.
Section 9: Session Recording Module
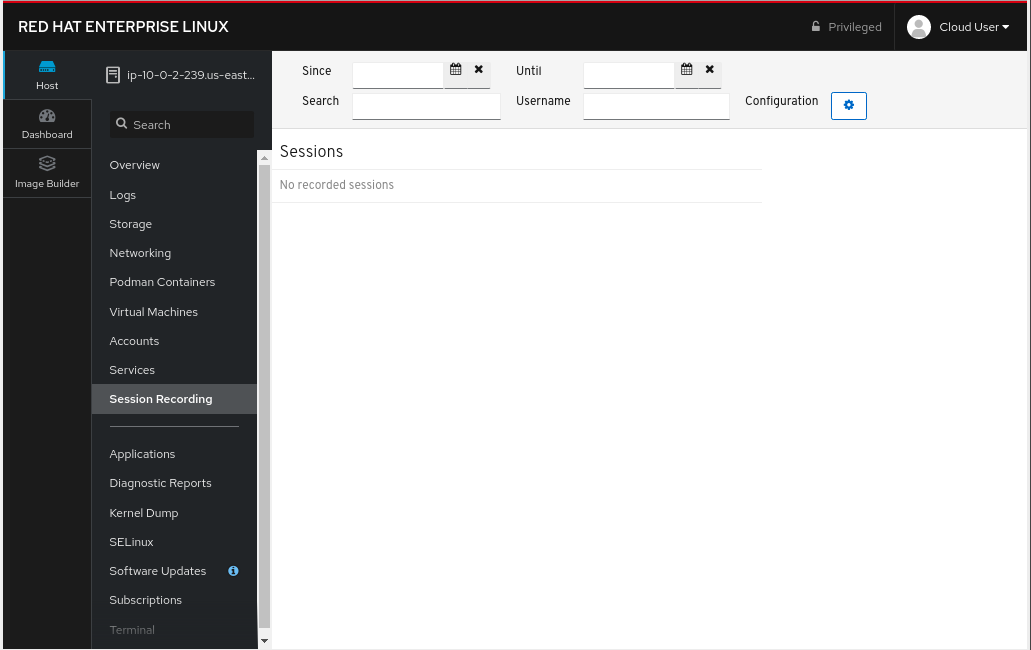
Figure 10: Web Console Session Recording Module
This module provides management of recorded terminal sessions.
Section 10: Applications Module
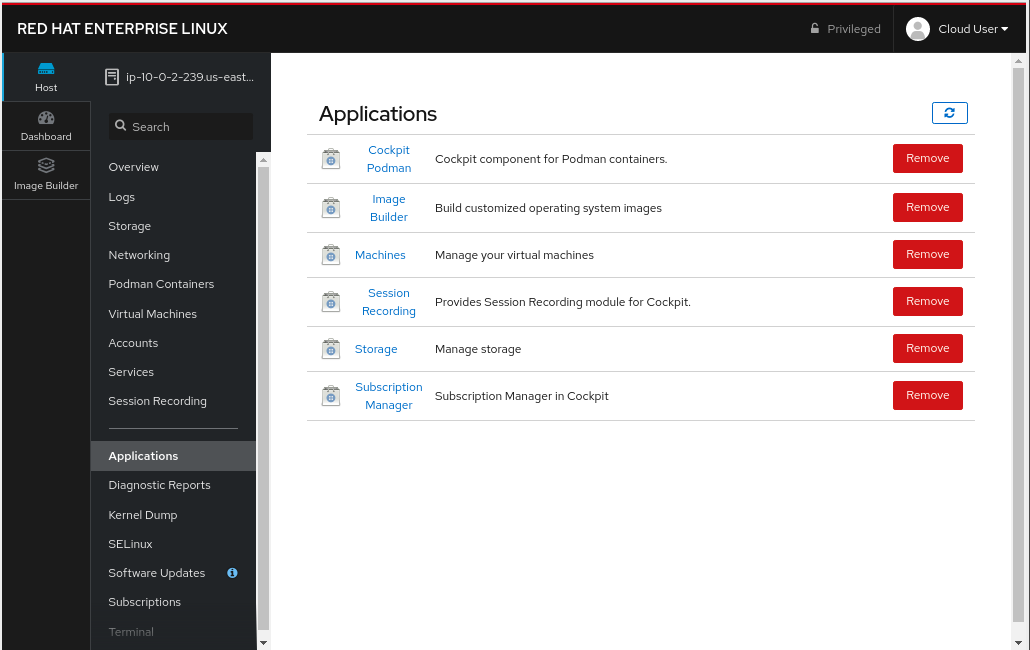
Figure 11: Web Console Applications Module
The applications module allows for the management of additional components for the web console. In this environment, we have already installed all of the modules, so the only option available is to remove them.
Section 11: Diagnostic Reports Module
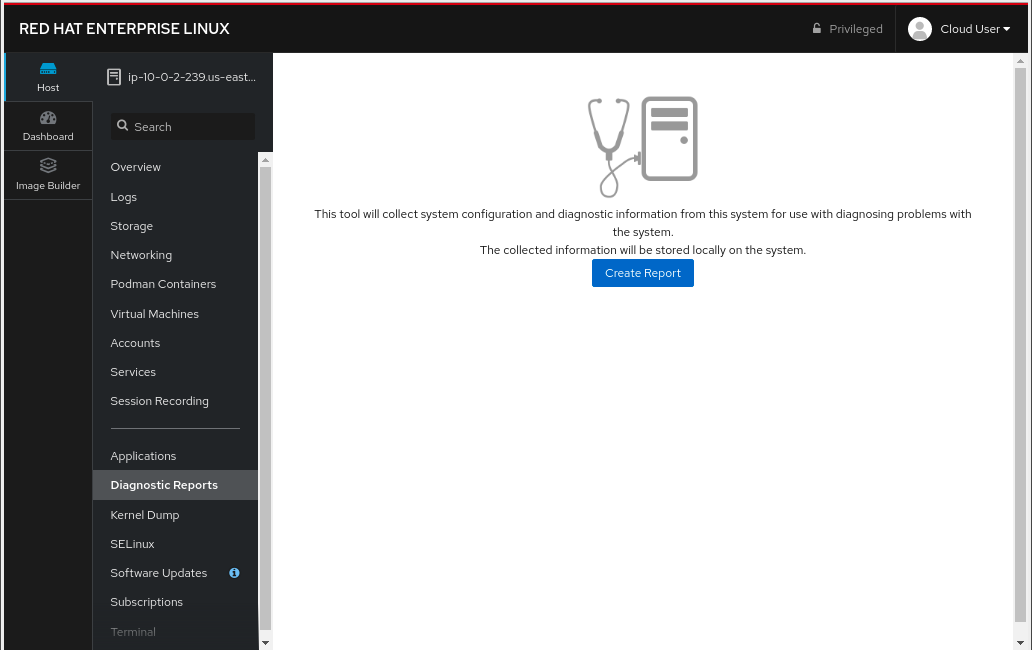
Figure 12: Web Console Diagnostic Reports Module
This module is where SOSreports are placed, when they are generated. You can trigger an SOSreport, for submission to Red Hat support, from here.
Section 12: Kernel Dump Module
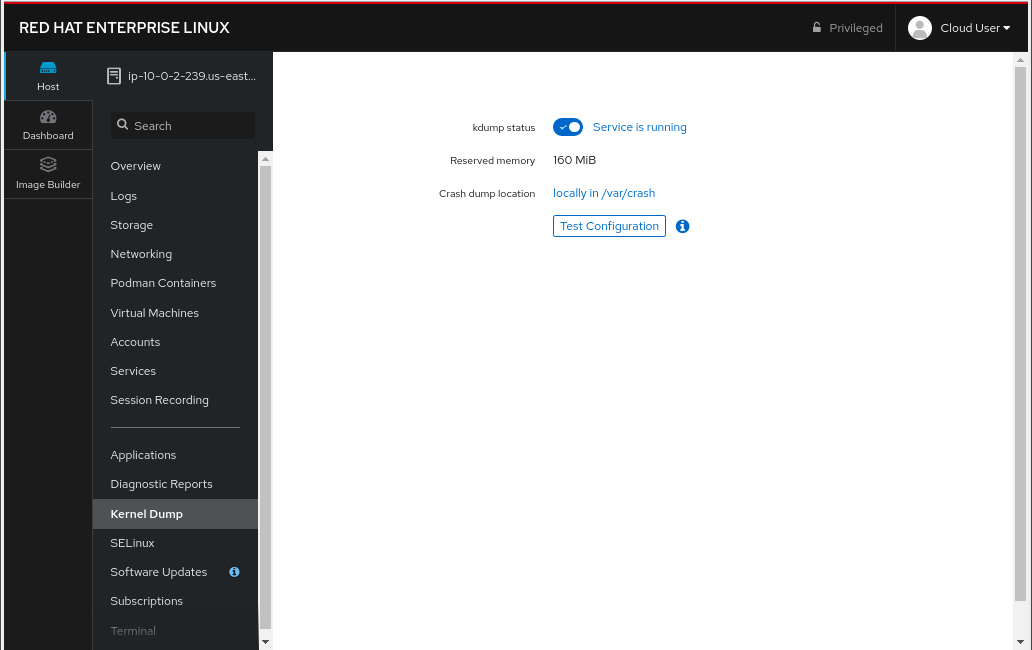
Figure 13: Web Console Kernel Dump Module
The kernel dump module allows for the configuration of where kernel diagnostic reports (or dumps) that are generated when the system crashes, are stored. Additionally, you can specify if you wish these dumps to be compressed. The buttons will turn the dump facility on and off, and can also be used to test the dump system by crashing the host.
Section 13: SELinux Module
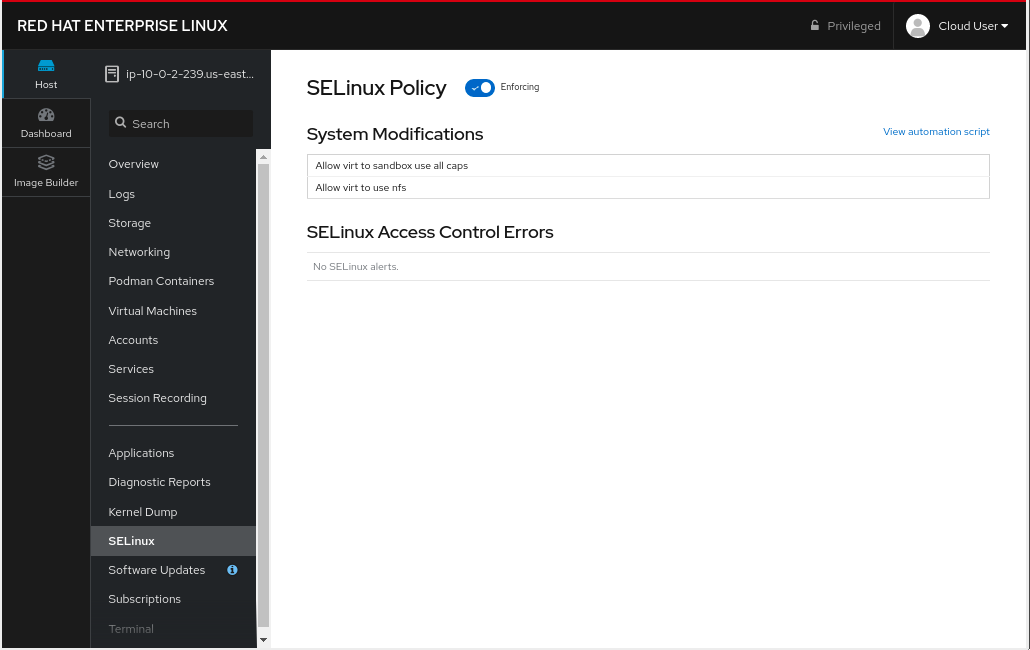
Figure 14: Web Console SELinux Module
This module allows the user to set SELinux to permissive or enforcing mode (off or on) and also shows any SELinux AVC (access vector cache) messages that may have been generated and any SELinux booleans changed on the standard SELinux profile on the system.
Section 14: Software Update Module
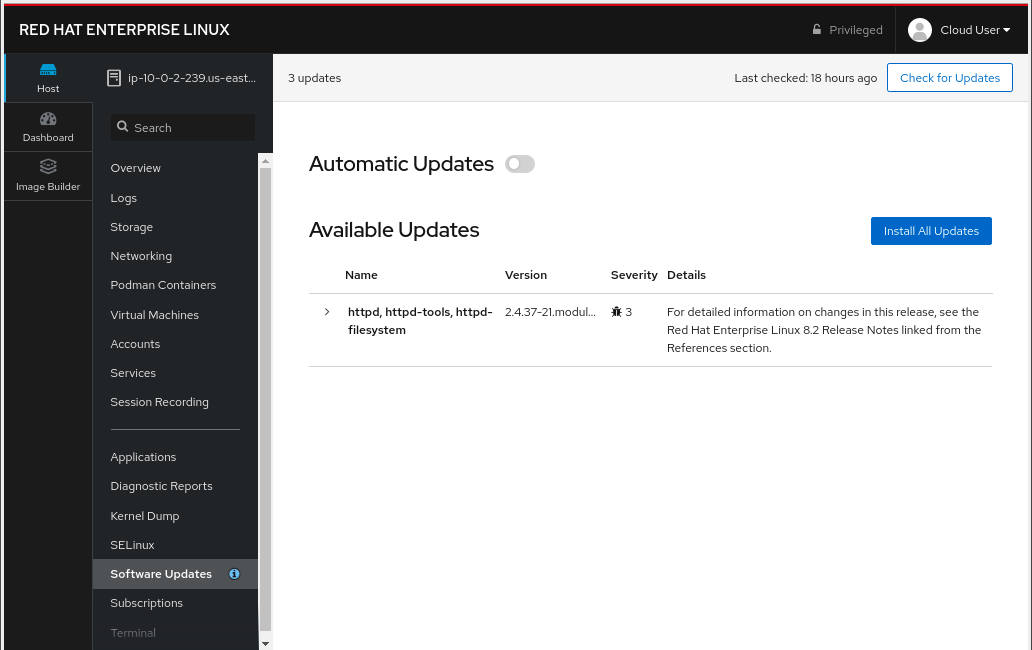
Figure 15: Web Console Kernel Dump Module
The software update module is where updates may be applied to the system. Additionally, automatic updating of packages may be configured.
Section 15: Subscriptions Module
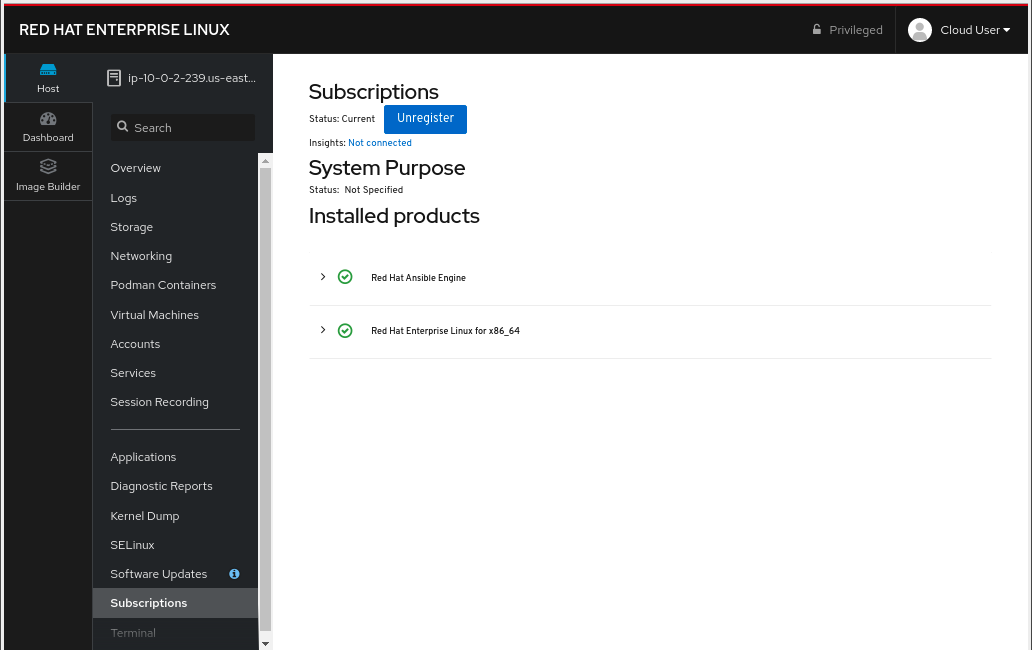
Figure 16: Web Console Subscriptions Module
This module allows the host to be registered or unregistered, and allows for the attachment or detachment of valid subscriptions.
Section 16: Terminal Module
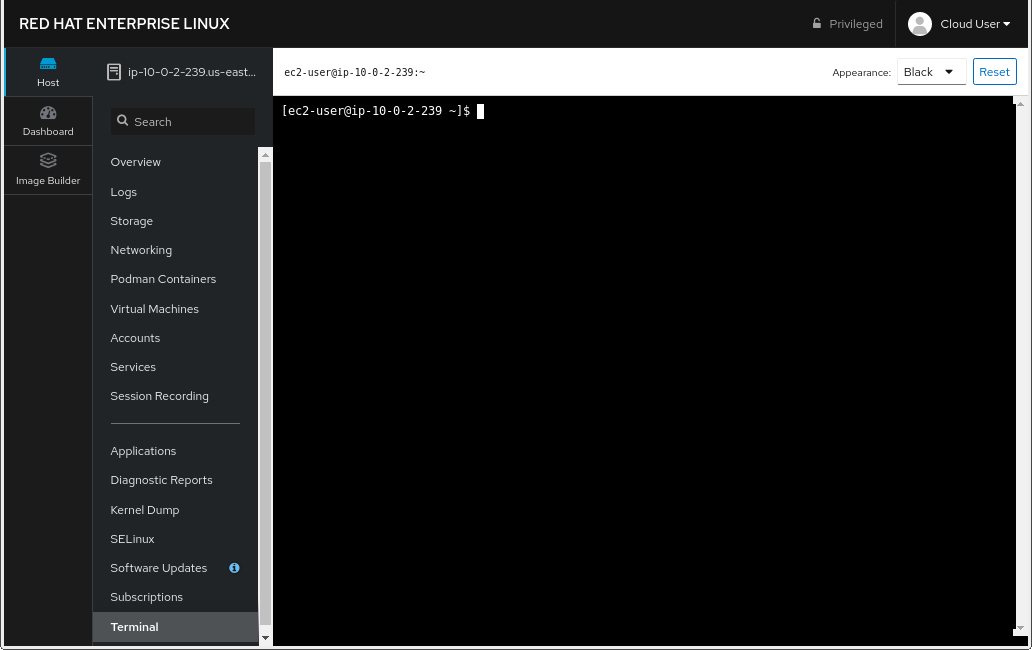
Figure 17: Web Console Terminal Module
The terminal module provides command-line access to the system, similar to an SSH session. Section 16.1 has some example commands to try if you’d like to test it out.
Section 16.1: Example terminal usage
Example 1: Use the following command to pull a RHEL image from the Red Hat repository:
sudo podman pull docker://docker.io/library/busyboxNow if you return to the Podman Containers tab (above, in Section 5), you should see this image listed; you may be prompted to start the Podman service as well. You’ll see more of podman later in Exercise 8.
Example 2: Try the Skopeo command
Skopeo provides the ability to inspect container images stored in a registry. The Inspect feature displays details of the selected image. The 'skopeo inspect' command’s ability to list all the tags associated with a selected image is a benefit over the docker tool.
sudo skopeo inspect docker://docker.io/library/busyboxExample 3: List firewall rules
nft is the nftables utility. Similar to ''iptables -L'', the following lists the system’s active firewall ruleset:
sudo nft list rulesetConclusion
The web console has a lot of new functionality, in version 8 of Red Hat Enterprise Linux. Hopefully, this brief (!) overview has demonstrated that, and given you a taste of how easily systems may be managed, with this new tool.
×
Workshop Details
| Domain |
|
|
| Workshop | ||
| Student ID |
Workshop Details
| Domain |
|
|
| Workshop | ||
| Student ID |