
Exercise 1.0 - Intro to Cockpit
Exercise Description
In this workshop, you will learn to navigate Cockpit and examine its features and capabilities.
What is Cockpit?
A remote manager for GNU/Linux servers
Cockpit is a server manager that makes it easy to administer your GNU/Linux servers via a web browser.
Cockpit makes it easy for any sysadmin to perform simple tasks, such as administering storage, inspecting journals and starting and stopping services.
Jumping between the terminal and the web tool is no problem. A service started via Cockpit can be stopped via the terminal. Likewise, if an error occurs in the terminal, it can be seen in the Cockpit journal interface.
You can monitor and administer several servers at the same time. Just add them with a single click and your machines will look after its buddies.
Cockpit and Docker are compatible
Cockpit makes it easy to monitor and administer Docker containers running on Cockpit-managed servers such as Project Atomic hosts. Some of the capabilities include:
-
Monitoring resources consumed by containers
-
Adjusting resources available to containers (Resource limits are enforced by the CGroup subsystem in the Linux kernel.)
-
Adjusting CPU shares
-
Assigning memory limits
-
More CGroup policy controls to come
-
Stopping, Starting, Deleting and Committing container instances
-
Running and Deleting container images
Section 1: Accessing the Cockpit web UI
Step 1. Use the following URL to access the Cockpit console on your node. Your instructor will provide a workshop name and student number. Enter this information in the appropriate space, within the URL.
https://example.0.redhatgov.io:9090Step 2. Log in to Cockpit
Login to Cockpit
Username: ec2-user

Password: <to be provided>
After logging in, you should see the Cockpit web UI.
Section 2: Navigate the Cockpit tool and examine its capabilities
Step 1. Examine the System display. Navigate using the left-side menu.
System: Shows information about the system that Cockpit is running on. This includes CPU usage, memory usage, disk I/O, and network traffic, as well as hardware and operating system details.
Click: Show Fingerprints | System Time | Power Options | Performance Profile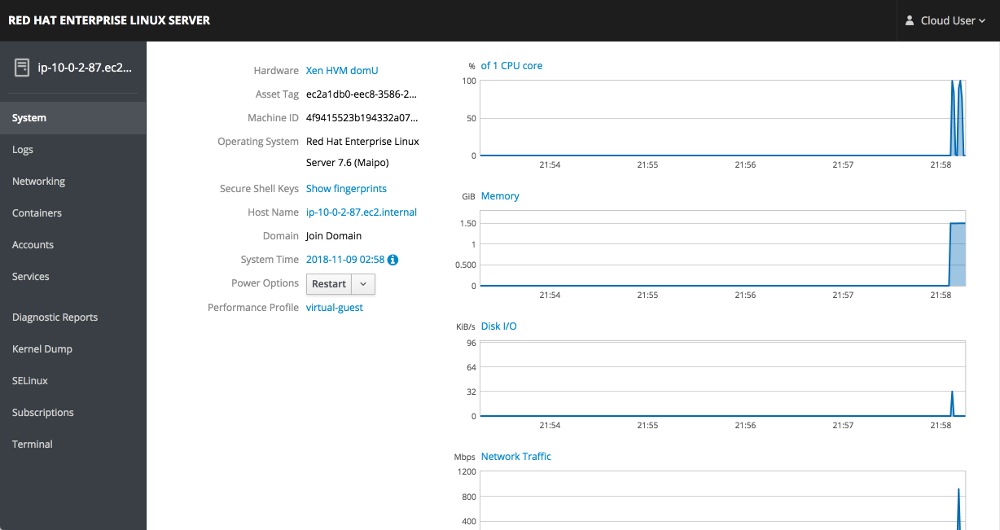
Step 2. Examine Services by clicking the System Services tab at the top of the display.
System Services: Shows the systemd services running on the Cockpit server. You can see which are active/enabled or inactive. You can also see other systemd features: Targets, sockets, timers, and paths.
Click: Targets | System Services | Sockets | Timers | Paths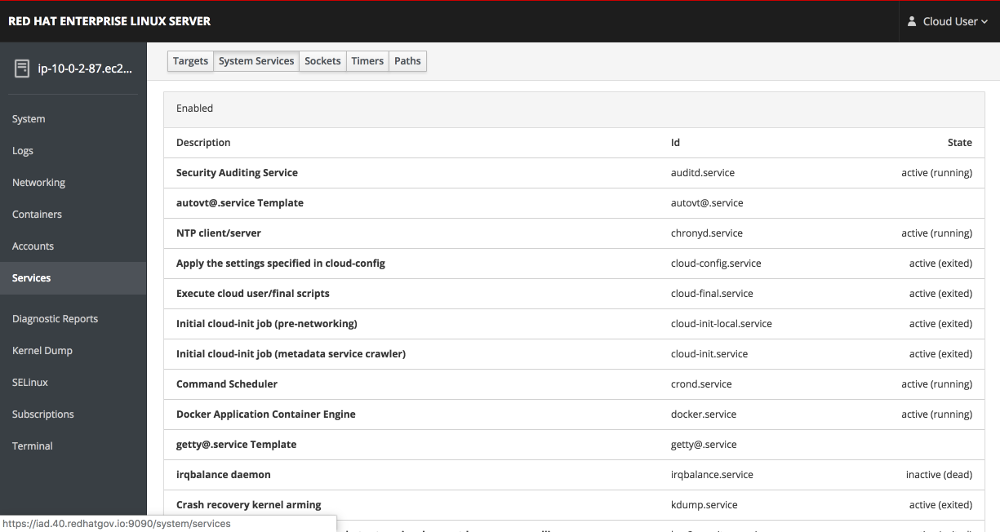
Step 3. Examine the Containers and images. Navigate to "Containers" using the left-side menu.
Containers: Lists all images available on the system, all running and non-running containers, combined CPU & memory usage graphs, and a storage usage bar.
Click to Launch an image
Click: Get new image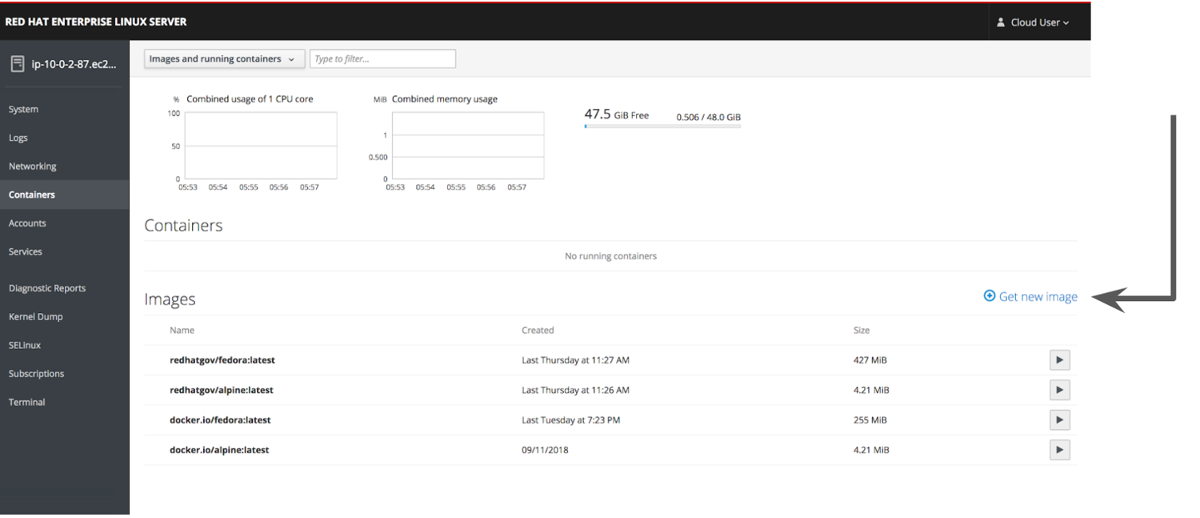
Step 4. Search For & Download Fedora
Use the following commandline to search for and download Fedora. Type in "docker.io/fedora" in order to search the online Docker registry.
Search: fedora -> download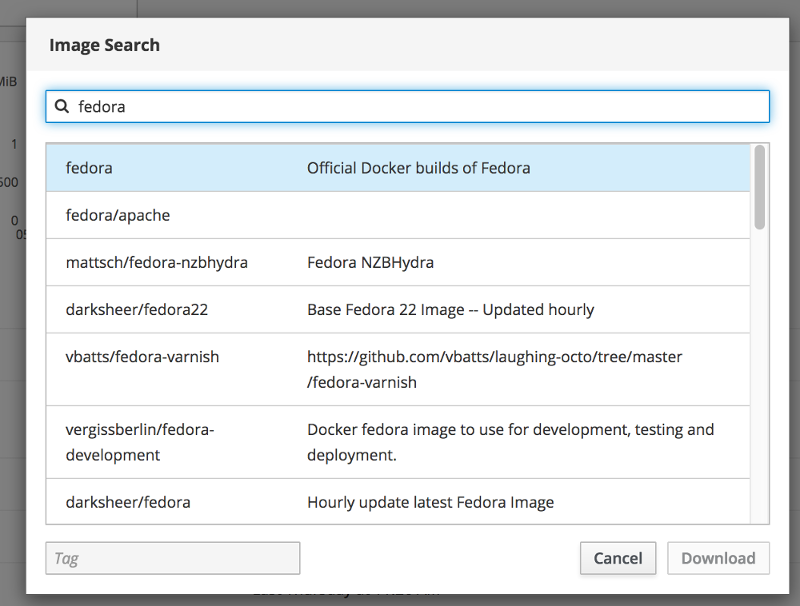
Step 5. Run the Fedora image simply by clicking 'Run'.
Click: Run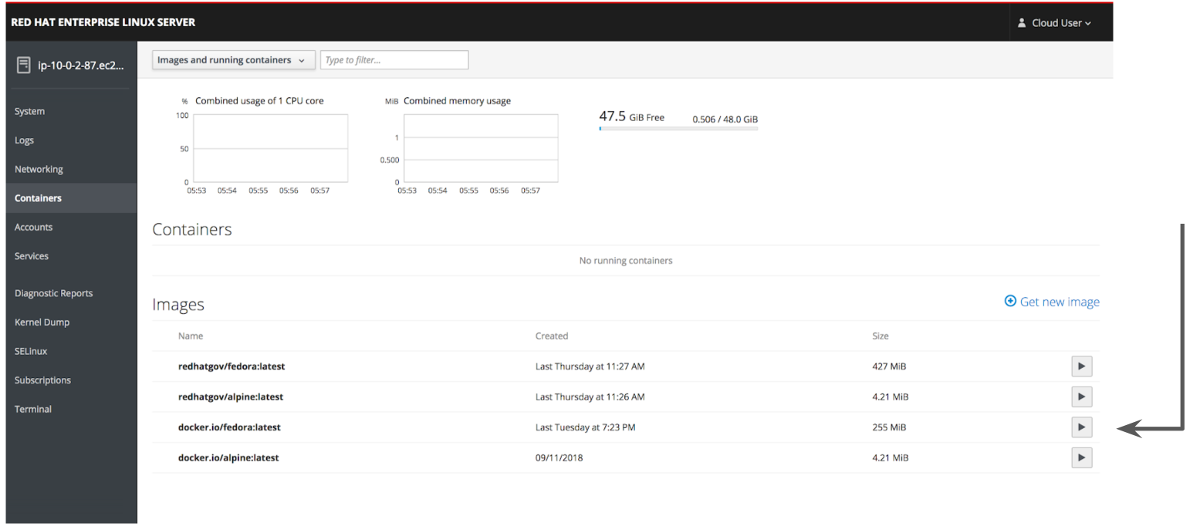
Then, add a command to run the image. ("Sleep" is a generic enough command.)
Command: sleep 999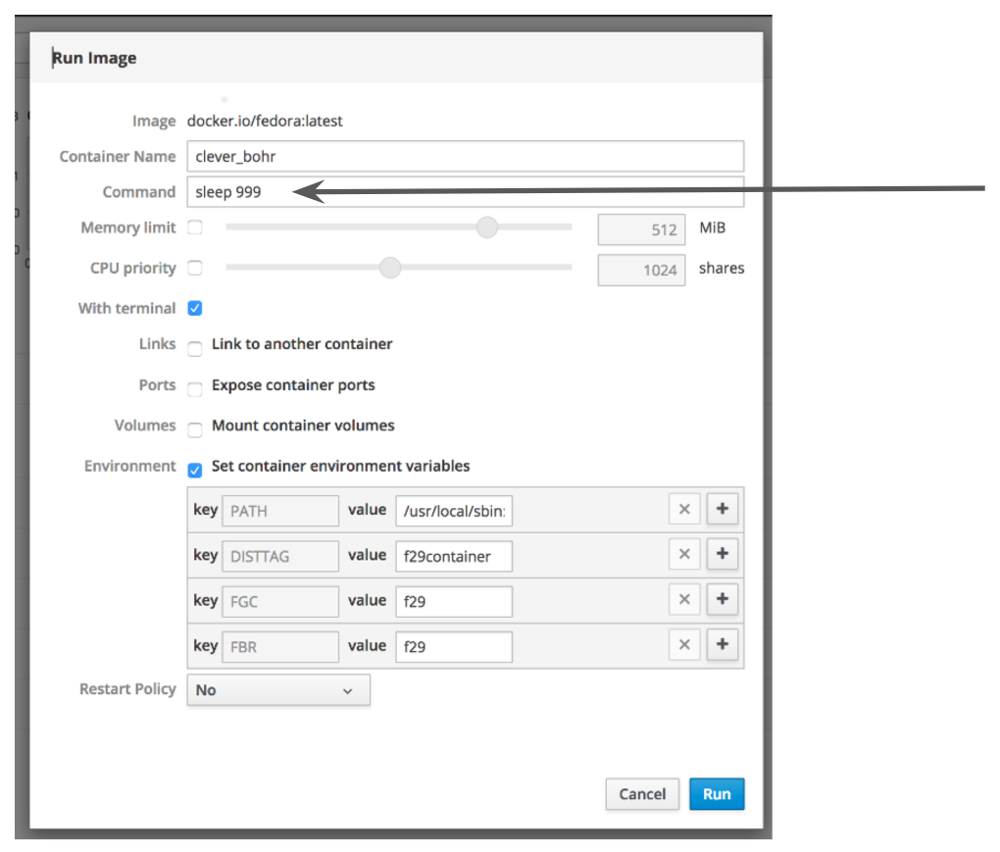
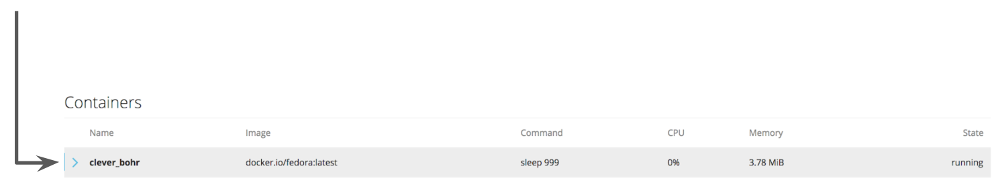
Step 6. View metadata
Click on the newly created container to view all of the metadata about the container. Shows the state, the command executed, the container and image IDs, a timestamp, as well as the container’s own terminal.
Click on the newly created container [>]
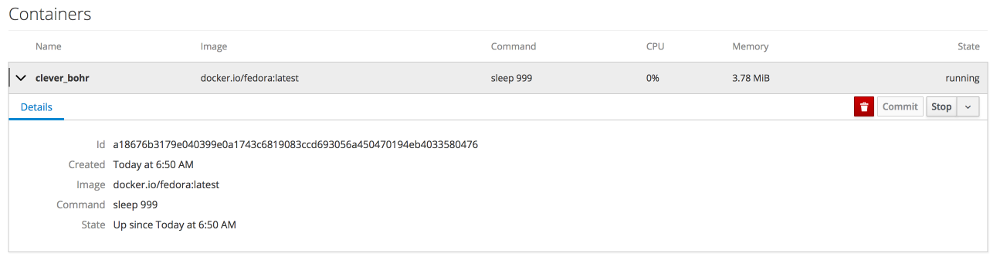
Expand the view and see all of the metadata about the container. Shows the state, the command executed, the container’s and image’s IDs, a timestamp, as well as the container’s own terminal:
Step 7. Navigate to 'Tools' via the left-side menu, to examine subscriptions, accounts, diagnostics, and terminal features.
Features and Capabilities
Tools: (Terminal)
Subscriptions: Displays what Red Hat products are installed and subscribed.
Accounts: Shows which administrative (root) and other users have accounts on
the system.
Diagnostic report: Collects system configuration and diagnostics information
and prepares a report, in an XZ format.
Terminal: Opens a Terminal (command line) session to the Cockpit system.
From there, you can run any commands available to the user you are logged in as.
Command: sudo ps -aStep 8. Delete the Container
When you’ve completed examining Cockpit, stop and delete the container using the following command.
Click: Stop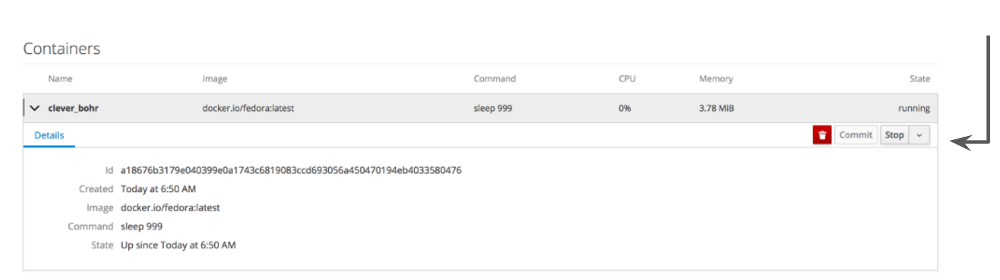
Drop Down: Select Everything to Refresh the page and display the exited container image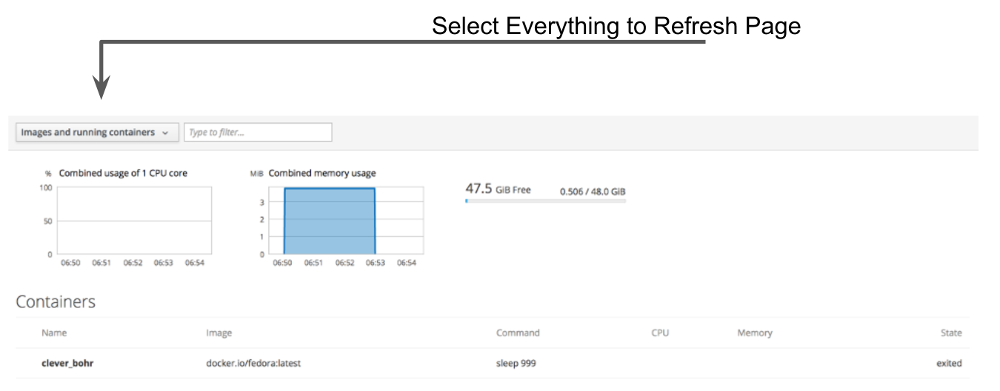
Select the [Trash] icon to remove the image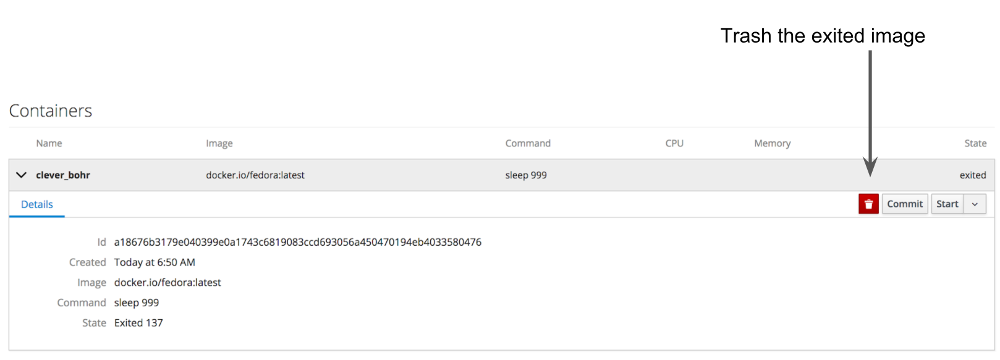
Confirm the delete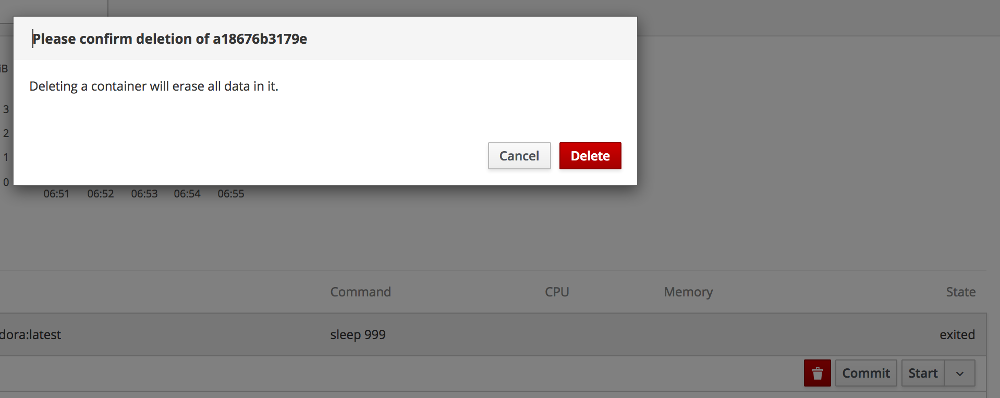
×
Workshop Details
| Domain |
|
|
| Workshop | ||
| Student ID |
Workshop Details
| Domain |
|
|
| Workshop | ||
| Student ID |