Source to Image (S2I)
One of the useful components of OpenShift is its source-to-image capability. S2I is a framework that makes it easy to turn your source code into runnable images. The main advantage of using S2I for building reproducible docker images is the ease of use for developers. You’ll see just how simple it can be in this lab.
Let’s build a node.js web app, using S2I
We can do this either via the command line or the web console. You decide which you’d rather do and follow the steps below.
Goto the terminal and type the following:
$ oc new-project metro-map
$ oc new-app --name=dc-metro-map https://github.com/RedHatGov/openshift-workshops.git --context-dir=dc-metro-map
$ oc expose service dc-metro-map
When using the CLI, OpenShift automatically detects the source code type and select the nodejs builder image.
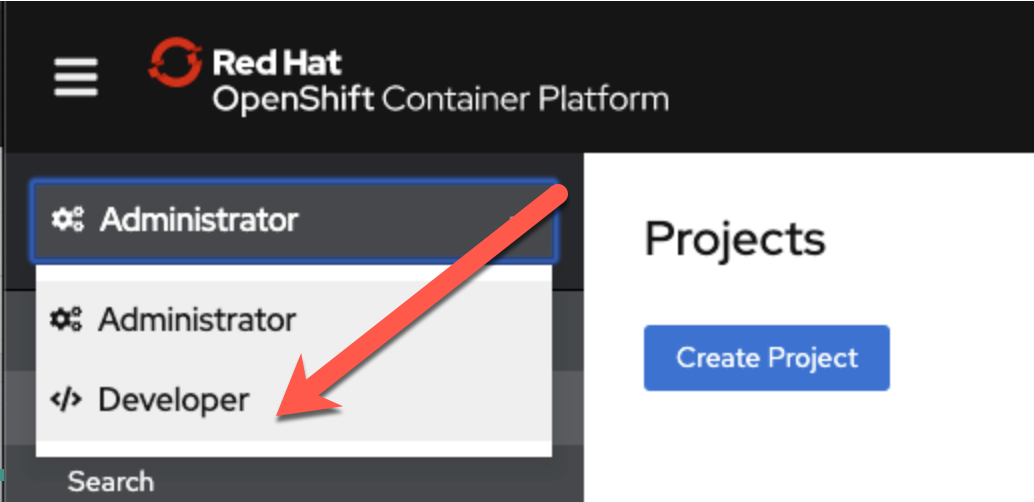
Switch to developer mode, if you're not already there
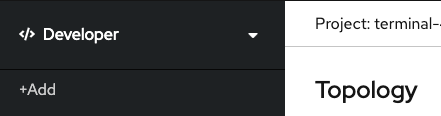
Click "+Add"
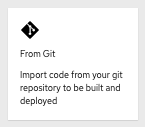
Click "From Git"
Fill out the "Git Repo URL" field as follows:
| Git Repo URL | https://github.com/RedHatGov/openshift-workshops.git |
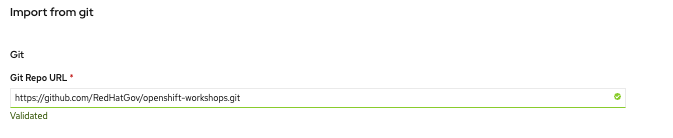
Ensure that the repository is validated (as shown above)
Click on the "Show Advanced Git Options" expender

Fill out the "Context Dir" field as follows:
| Context Dir | /dc-metro-map |
Under "Builder", click click on the "Node.js" icon
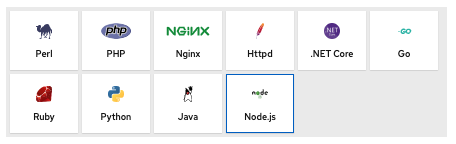
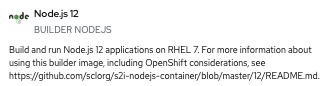
Select Node.js
Fill out the fields, under "General" as follows:
| Application | Create Application |
| Application Name | dc-metro-map |
| Name | dc-metro-map |
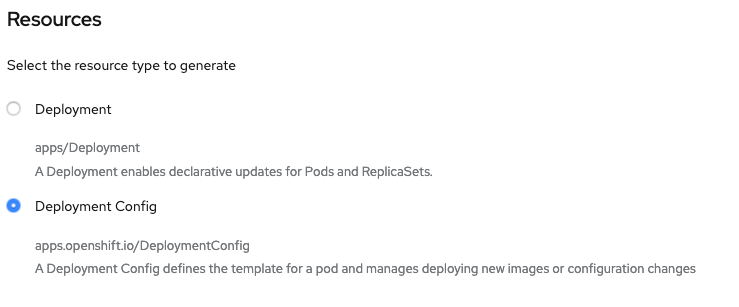
Choose "Deployment Configuration"
Scroll to the bottom and click "Create"
Check out the build details
We can see the details of what the S2I builder did. This can be helpful to diagnose issues if builds are failing.
TIP: For a node.js app, running “npm shrinkwrap” is a good practice to perform on your branch before releasing changes that you plan to build/deploy as an image with S2I
Goto the terminal and type the following:
$ oc get builds
Note the name of your build from the above command output and use it to see the logs with:
$ oc logs builds/[BUILD_NAME]
The console will print out the full log for your build. Note, you could pipe this to more or less for easier viewing in the CLI.
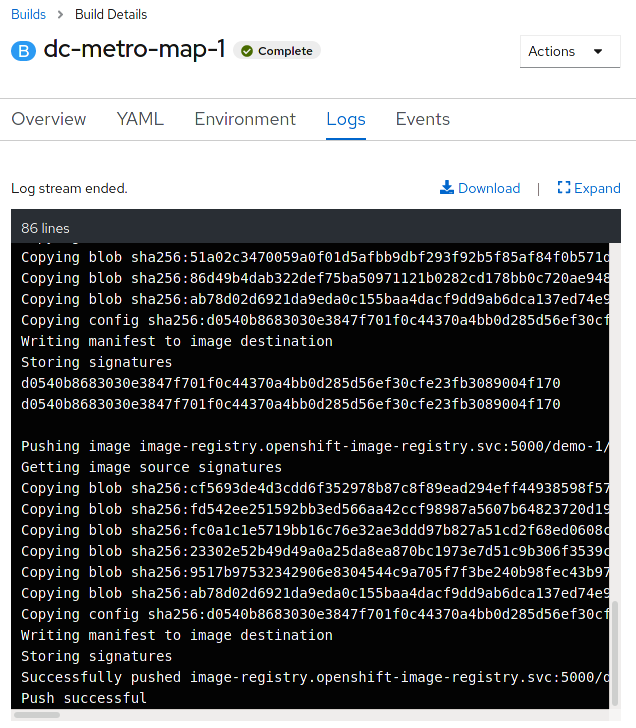
Click on "Topology", the "node"/"dc-metro-map" icon, and then on "View logs"
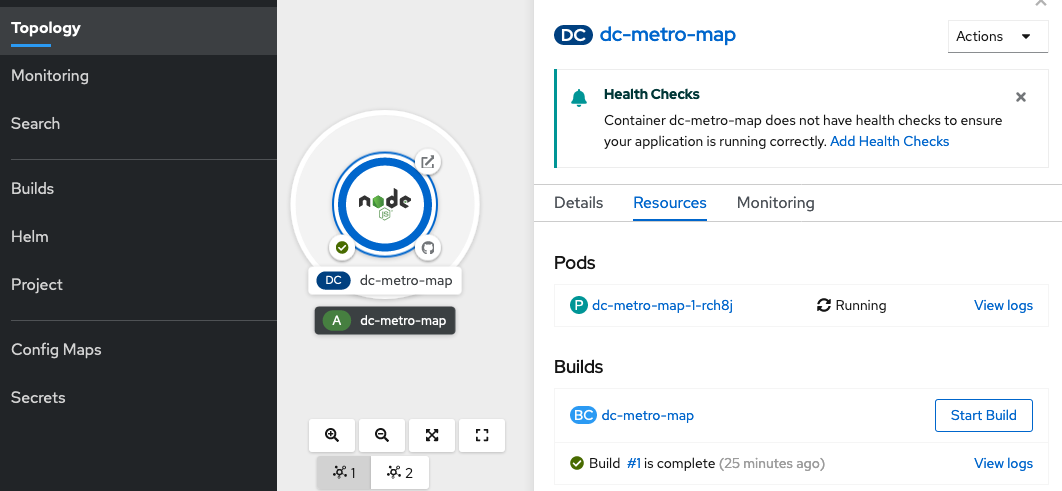
You should see a log output similar to the one below:
See the app in action
Let’s see this app in action!
Goto the terminal and type the following:
$ oc get routes
Copy the HOST/PORT and paste into your favorite web browser:
Click on "Topology"

Click the arrow, at the top right corner of the "dc-metro-map" icon, to launch a new tab/window, with the running app
The app should look like this in your web browser:
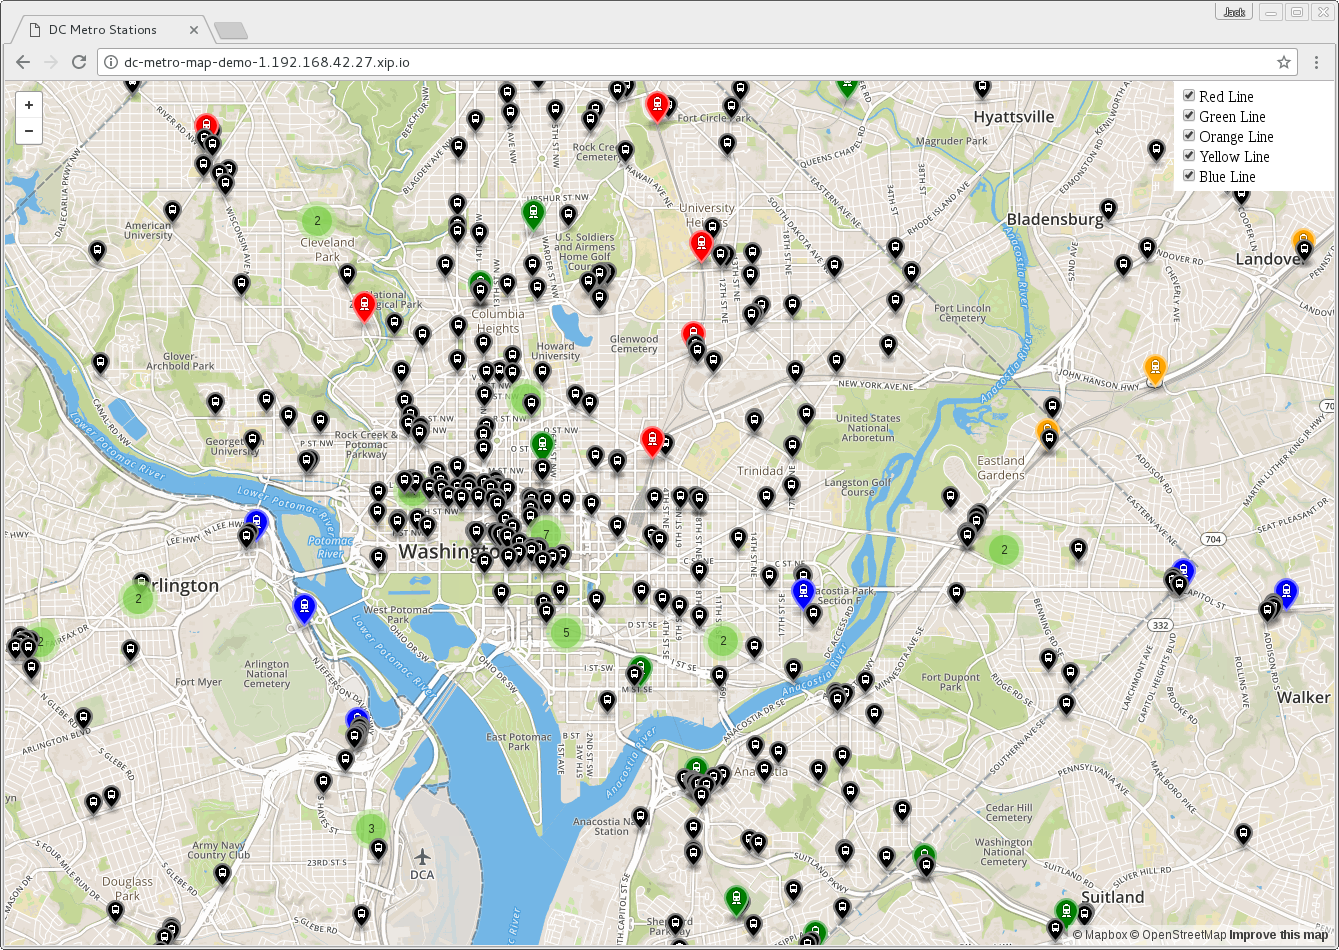
Clicking the checkboxes will toggle on/off the individual metro stations on each colored line. A numbered icon indicates there is more than one metro station in that area and they have been consolidated - click the number or zoom in to see more.
Now let’s examine the application in Dynatrace
Switch back to the Dynatrace interface and select “Smartscape topology” -> “Services” -> “dc-metro-map” and observice the dependency mapping of this single-tier application.
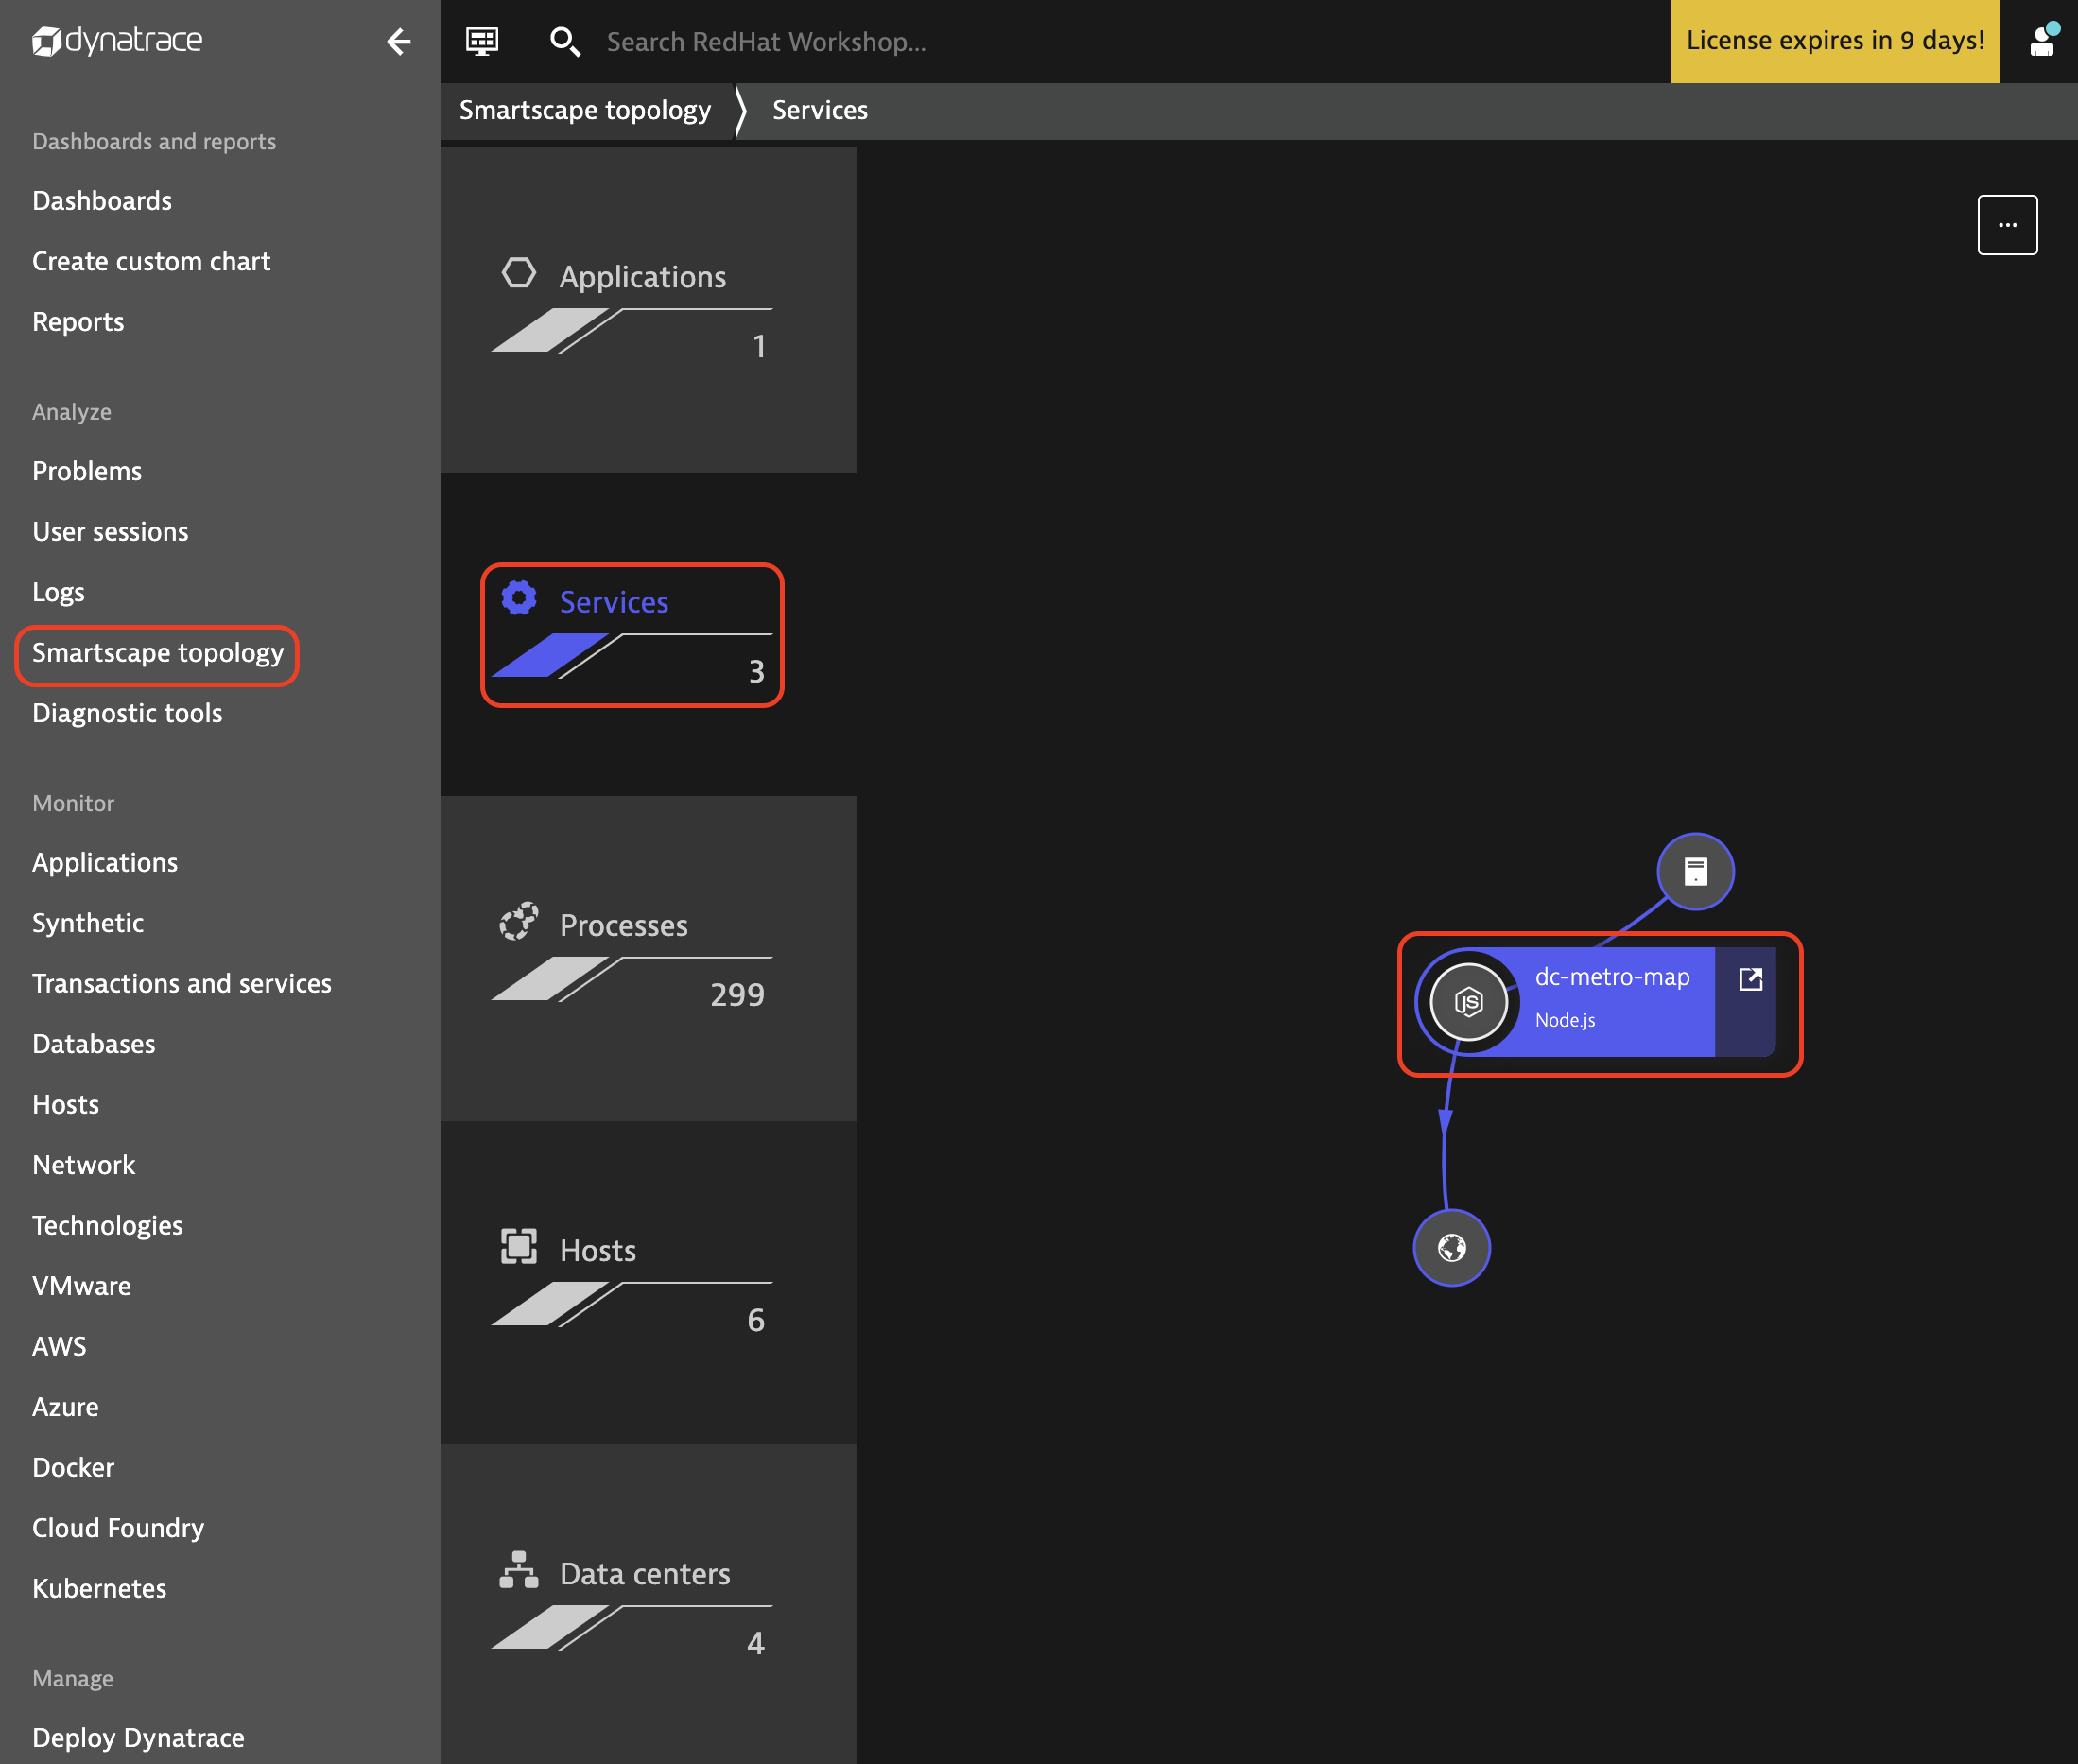
The vertical mapping on the left shows the underlying process groups, host(s), and Data center(s) for the dc-metro-map service. On the right hand side of the Smartscape topology view shows the peer services that the dc-metro-map service is communicating with. Continue to navigate the Dynatrace interface to examine the details of the dc-metro-map service and the node.js process group it is running in.
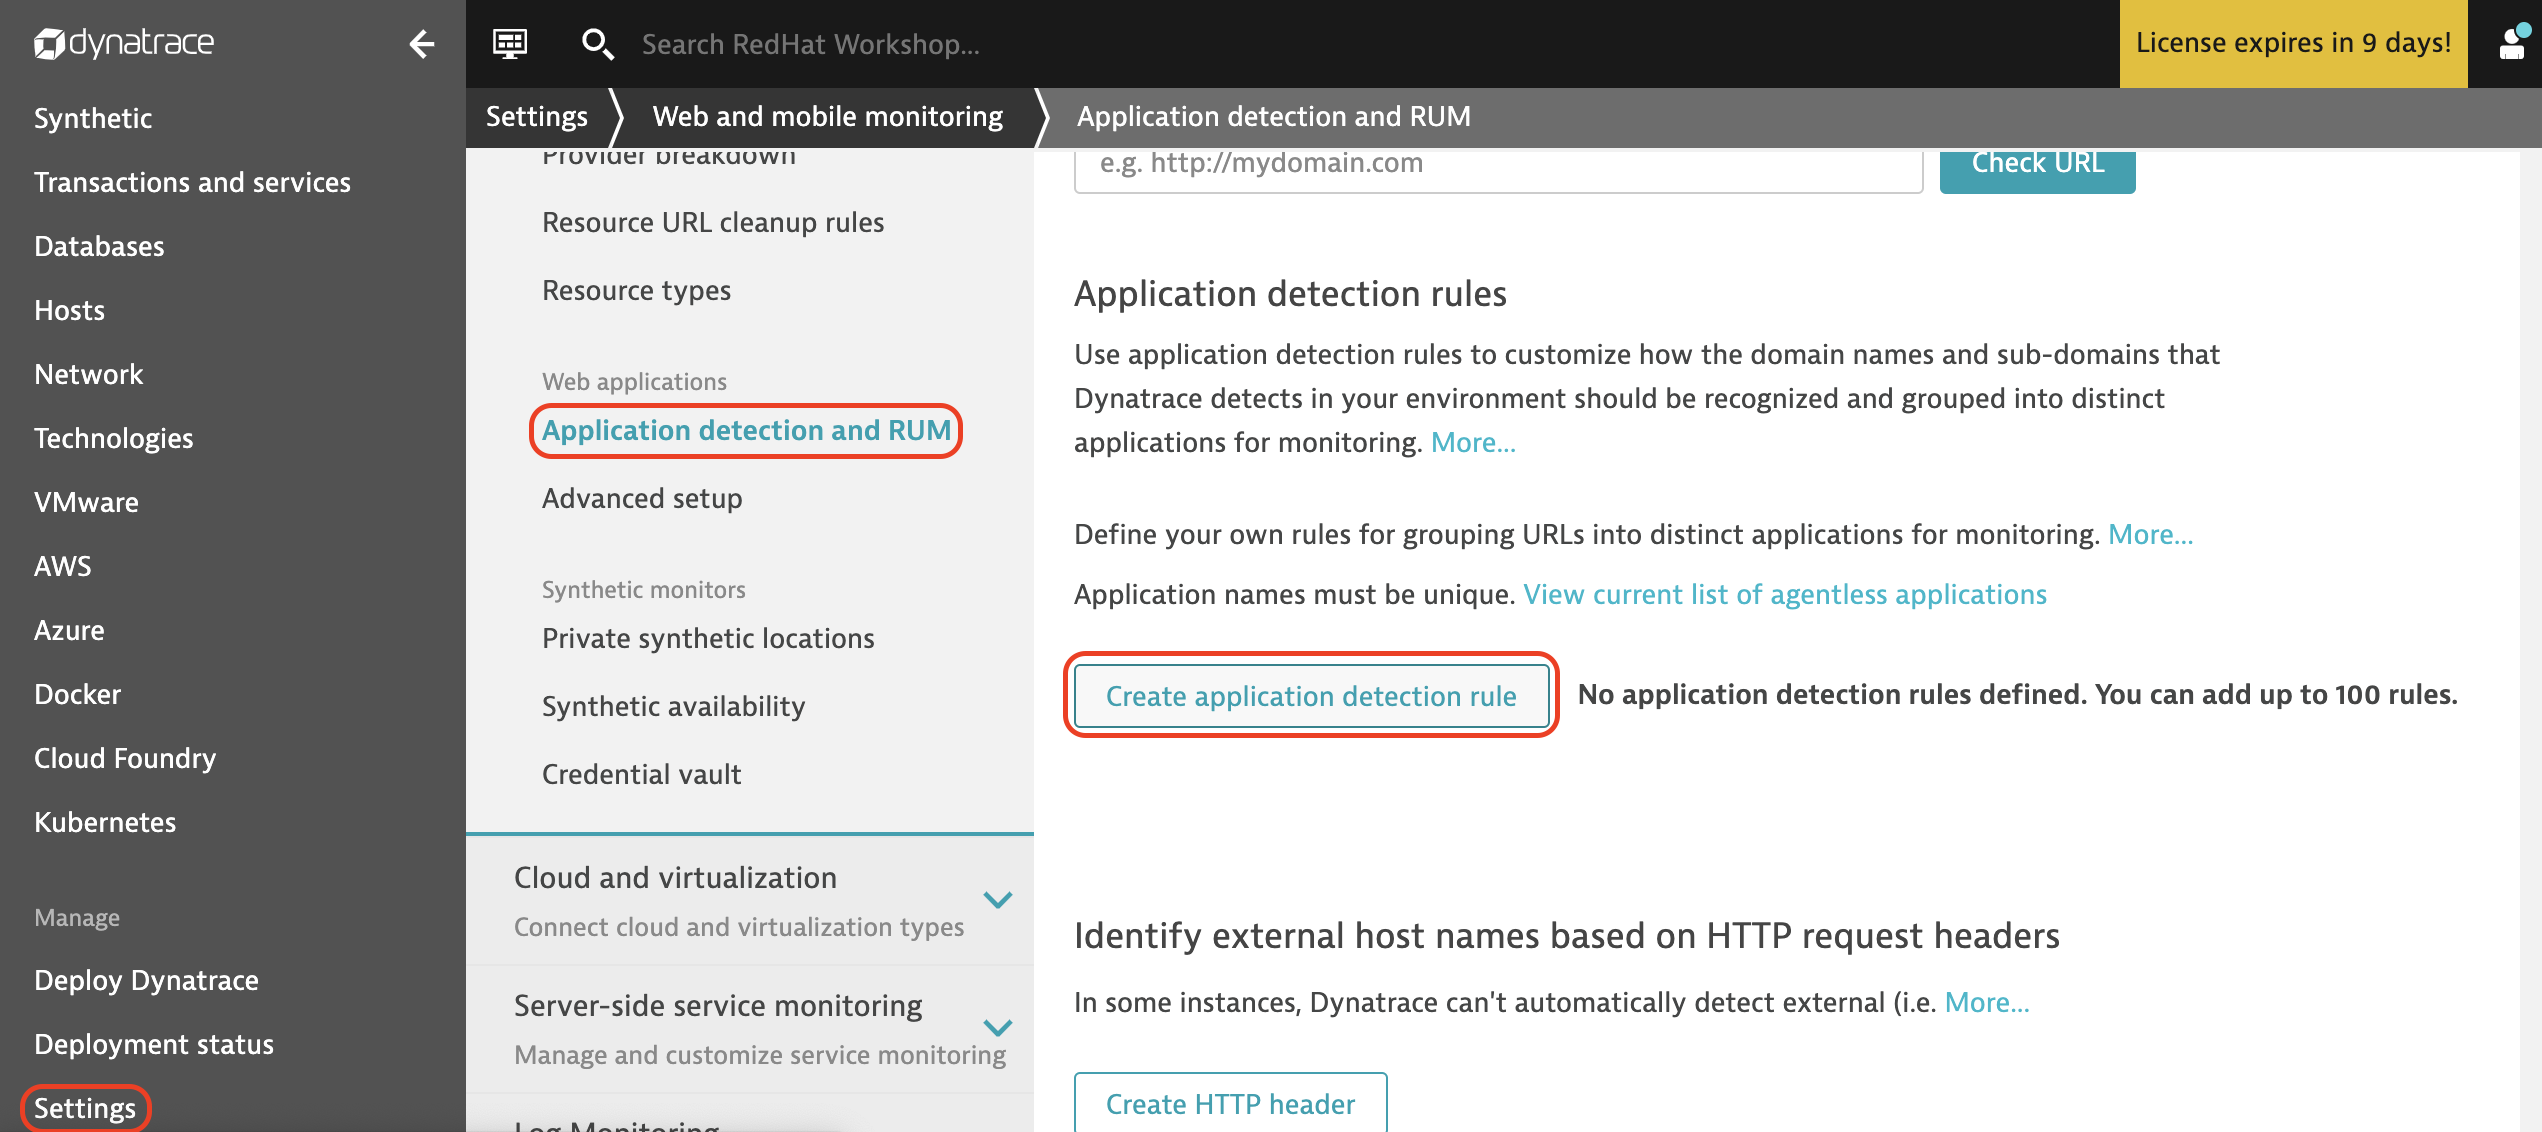
Although the processes and services are automatically discovered once the OneAgent is deployed, we still need to define the web entry point as an application using an application detection rule. By default, all user traffic is placed under “My web application.” To create the “DC Metro Map” application and track the real user performance data for this application, start by defining the dc-metro-map entry point. Click on “Settings” -> “Web and mobile monitoring” -> “Application detection and RUM” -> “Create application detection rule”
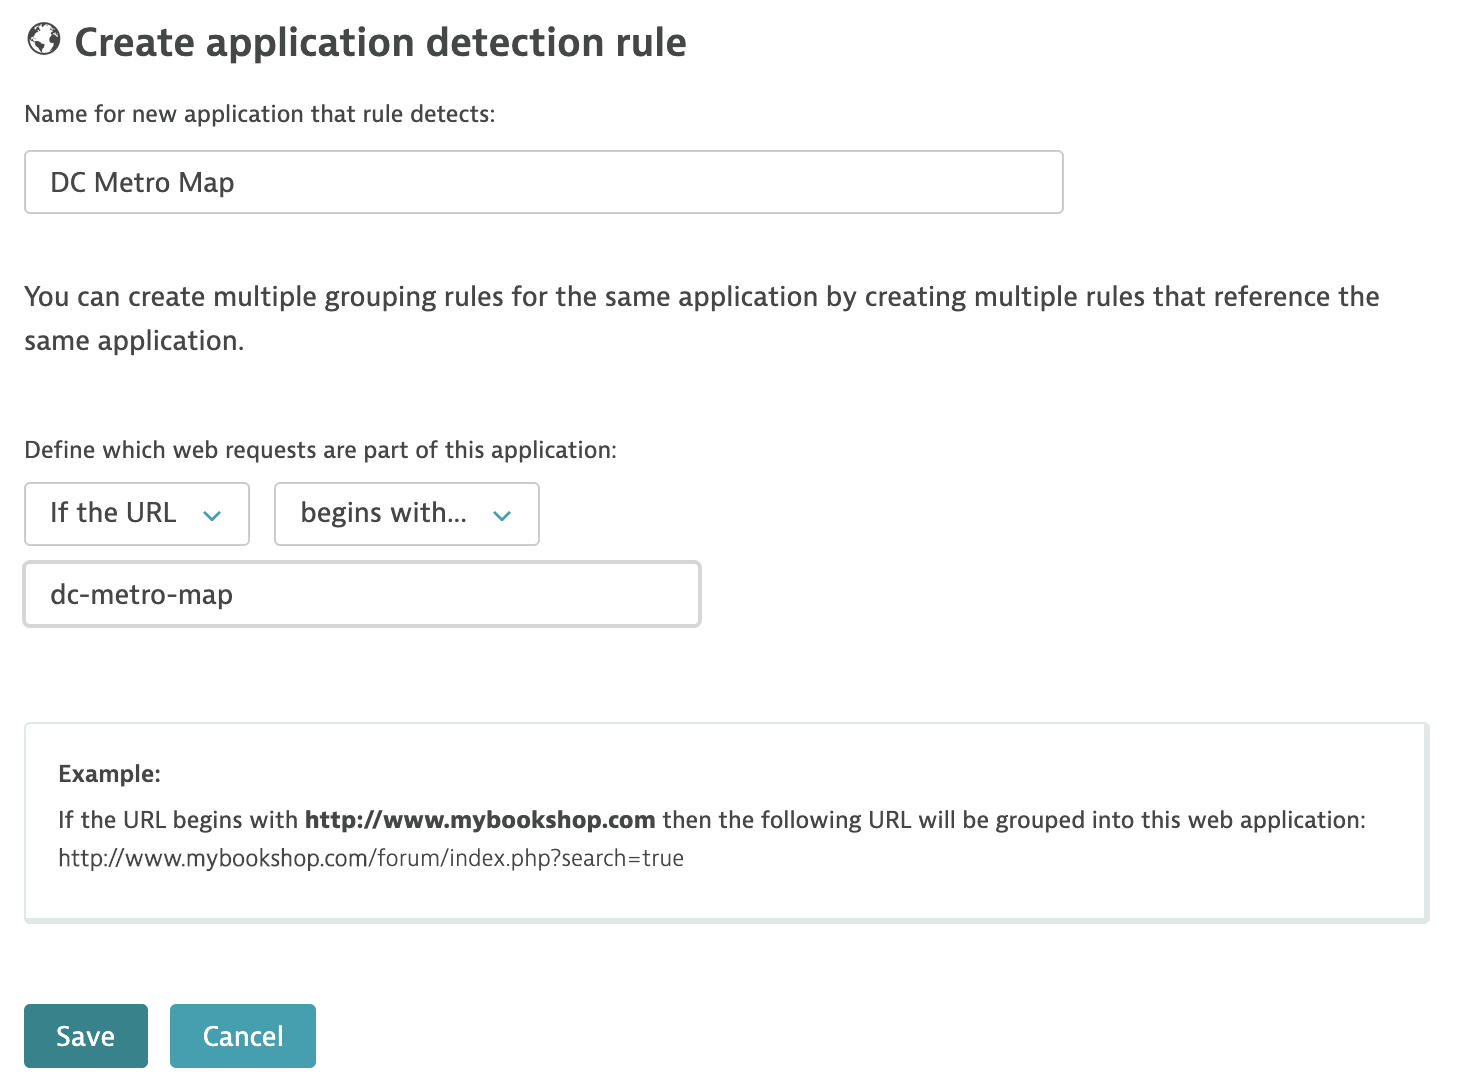
Enter “DC Metro Map” for the new application. Select “If the URL” and “begins with…” as the definition. Enter “http://dc-metro-map” in the example text box. Finish defining the application by clicking on “Save.”
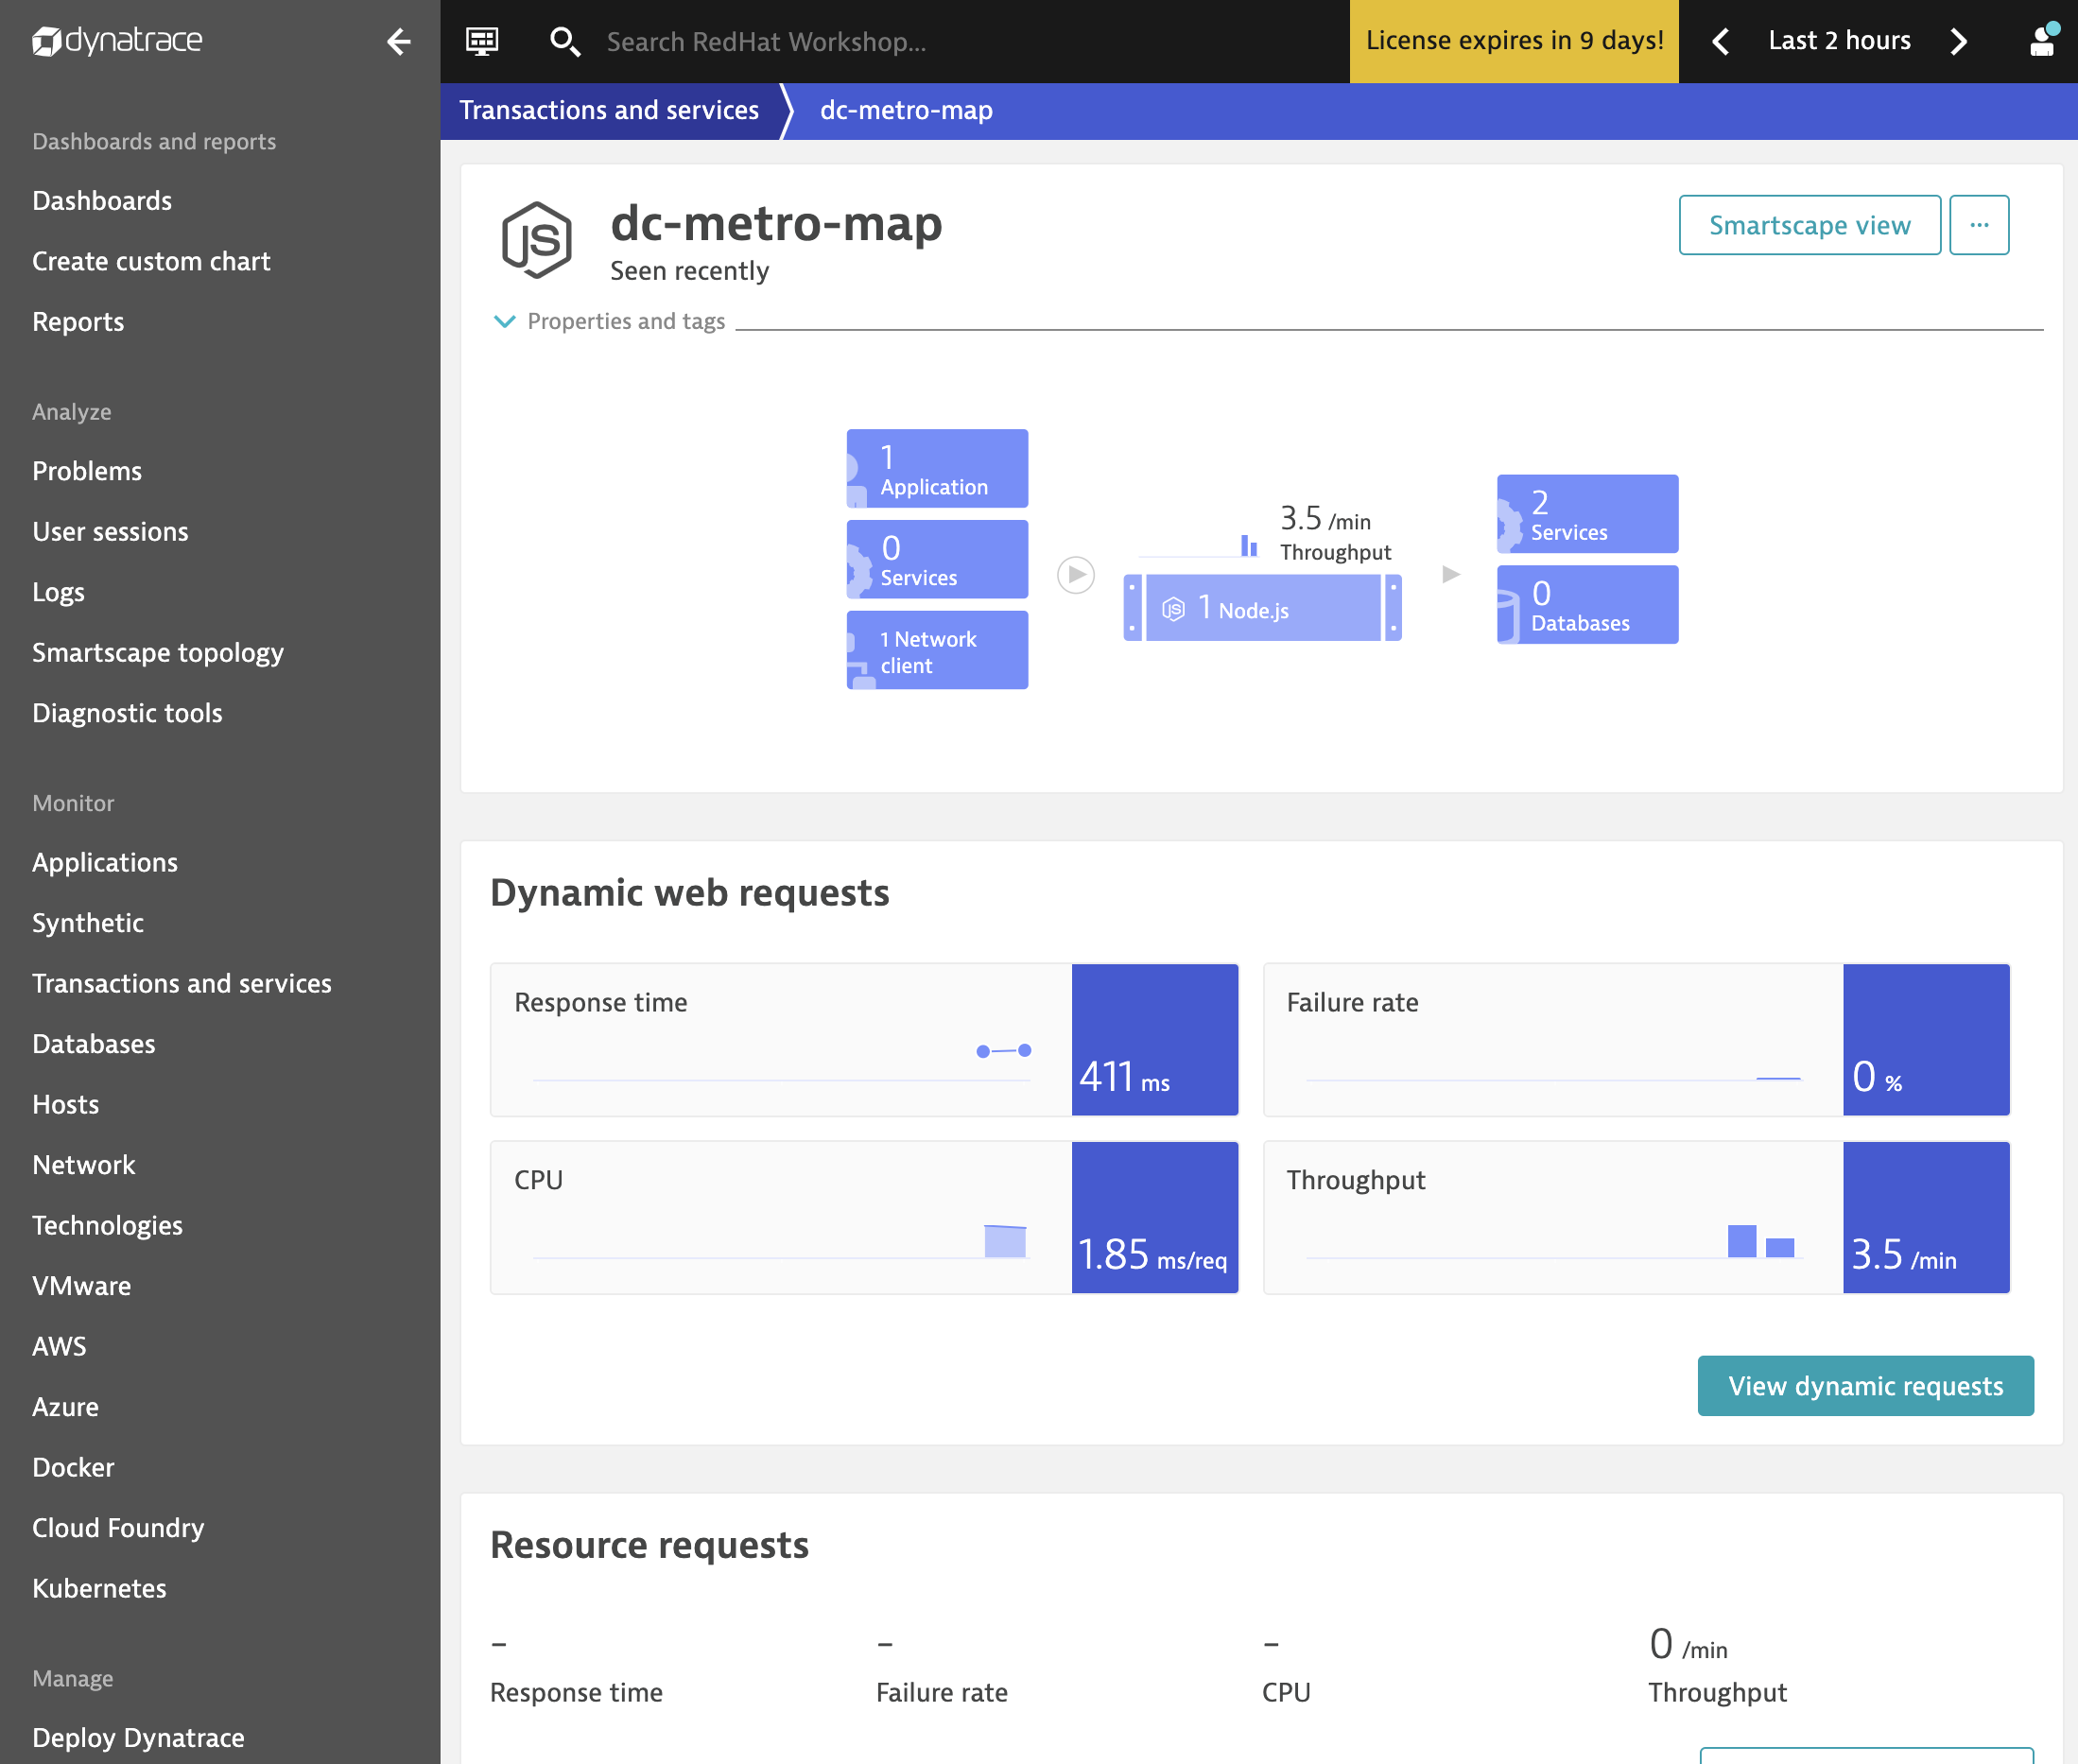
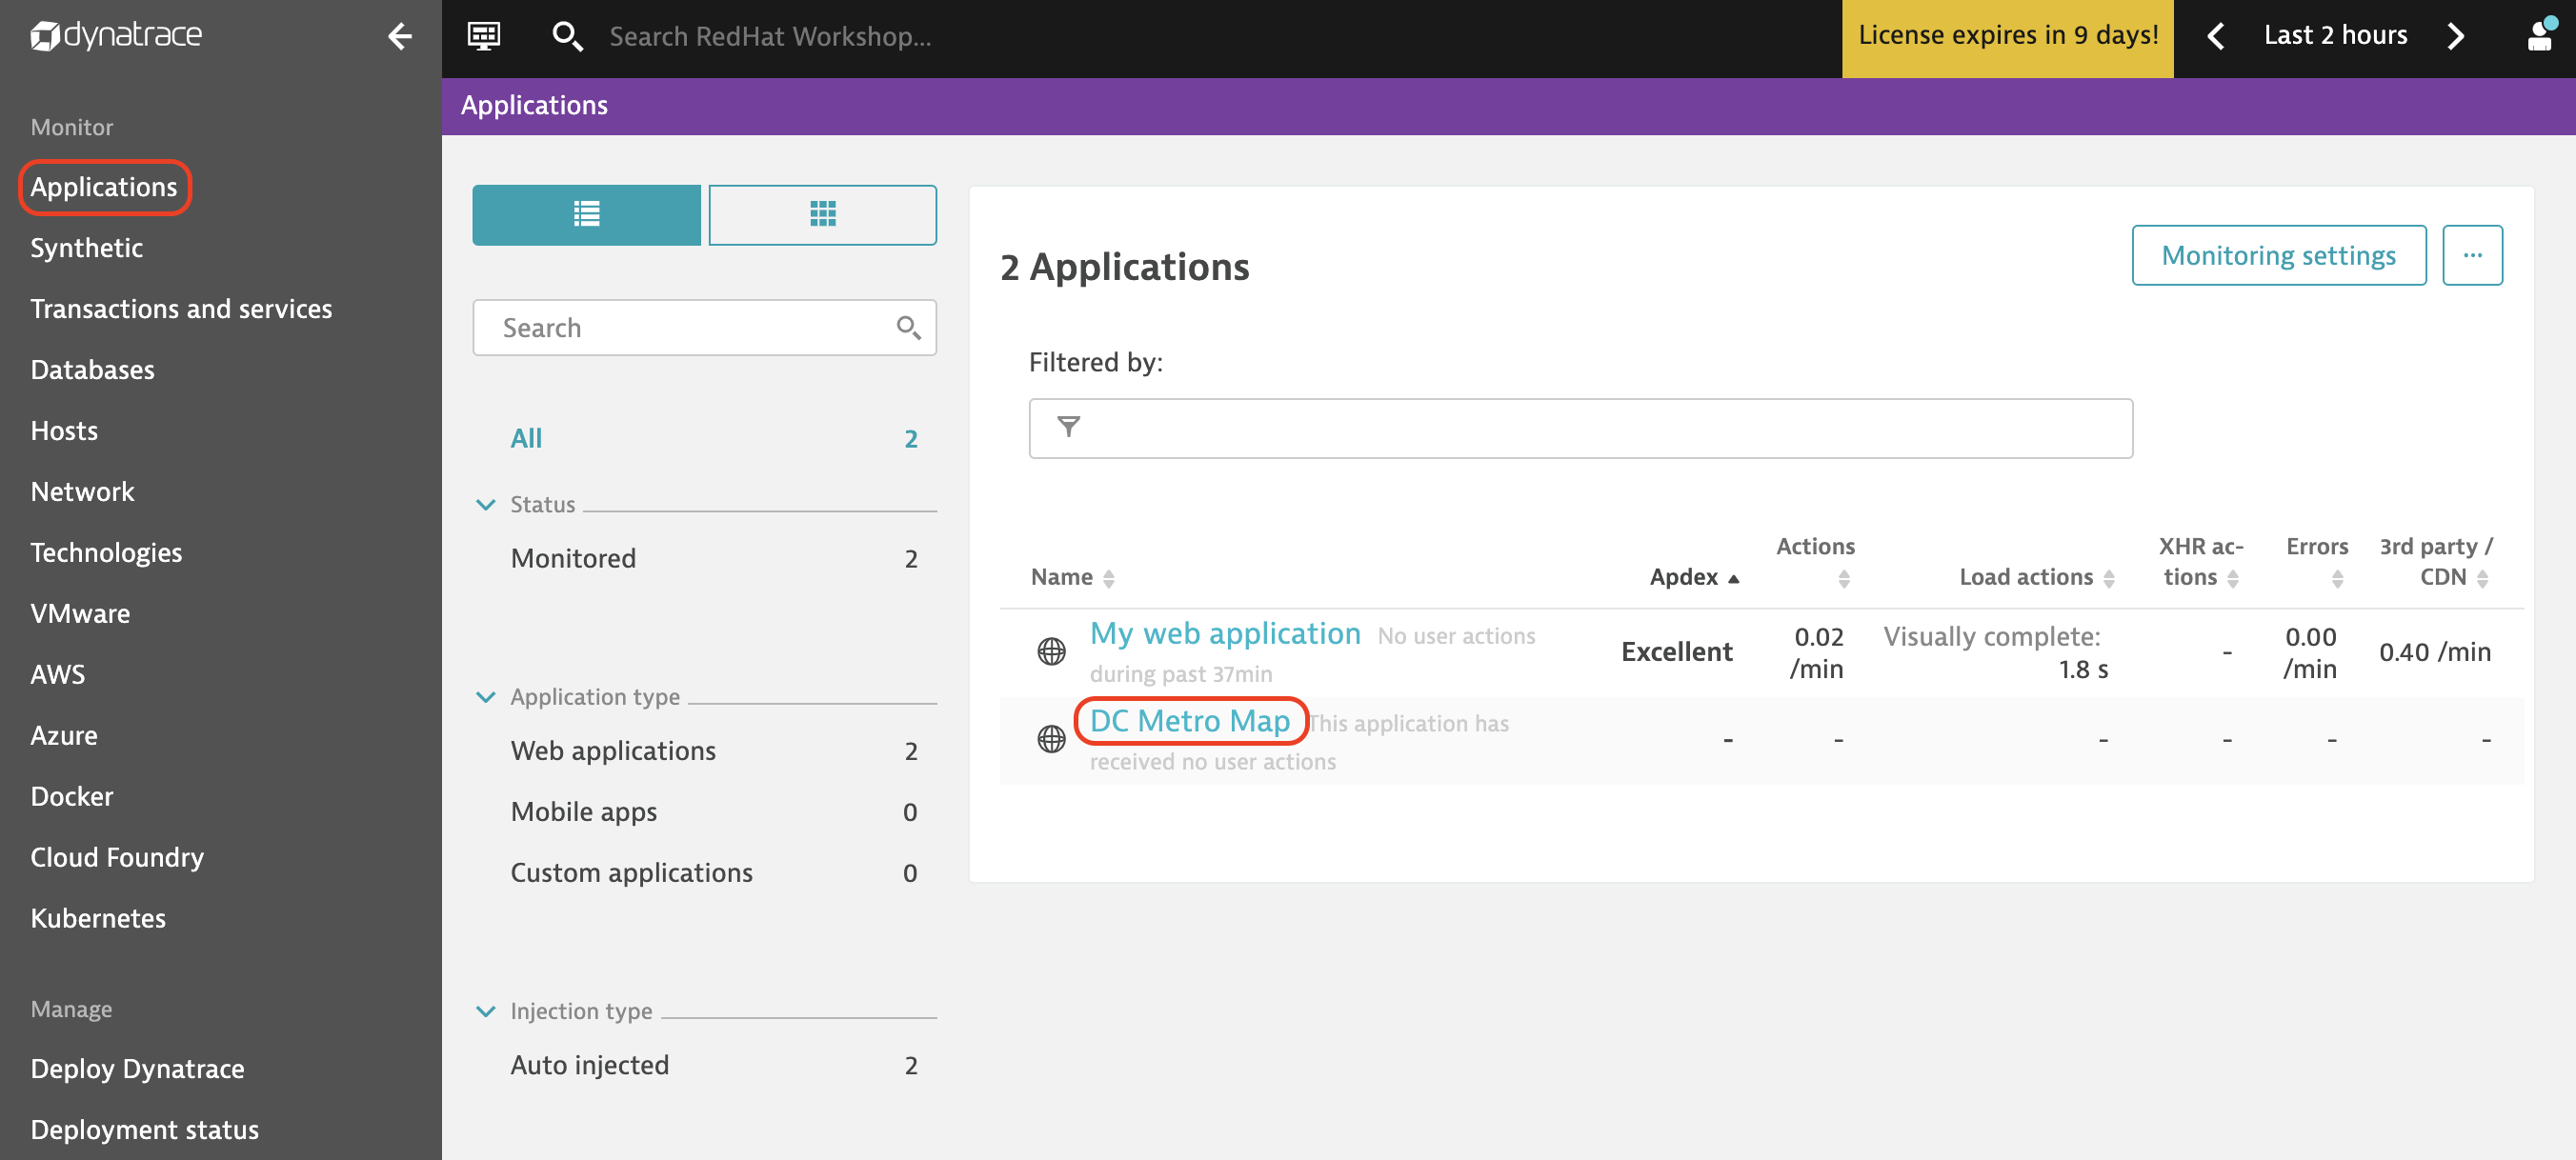
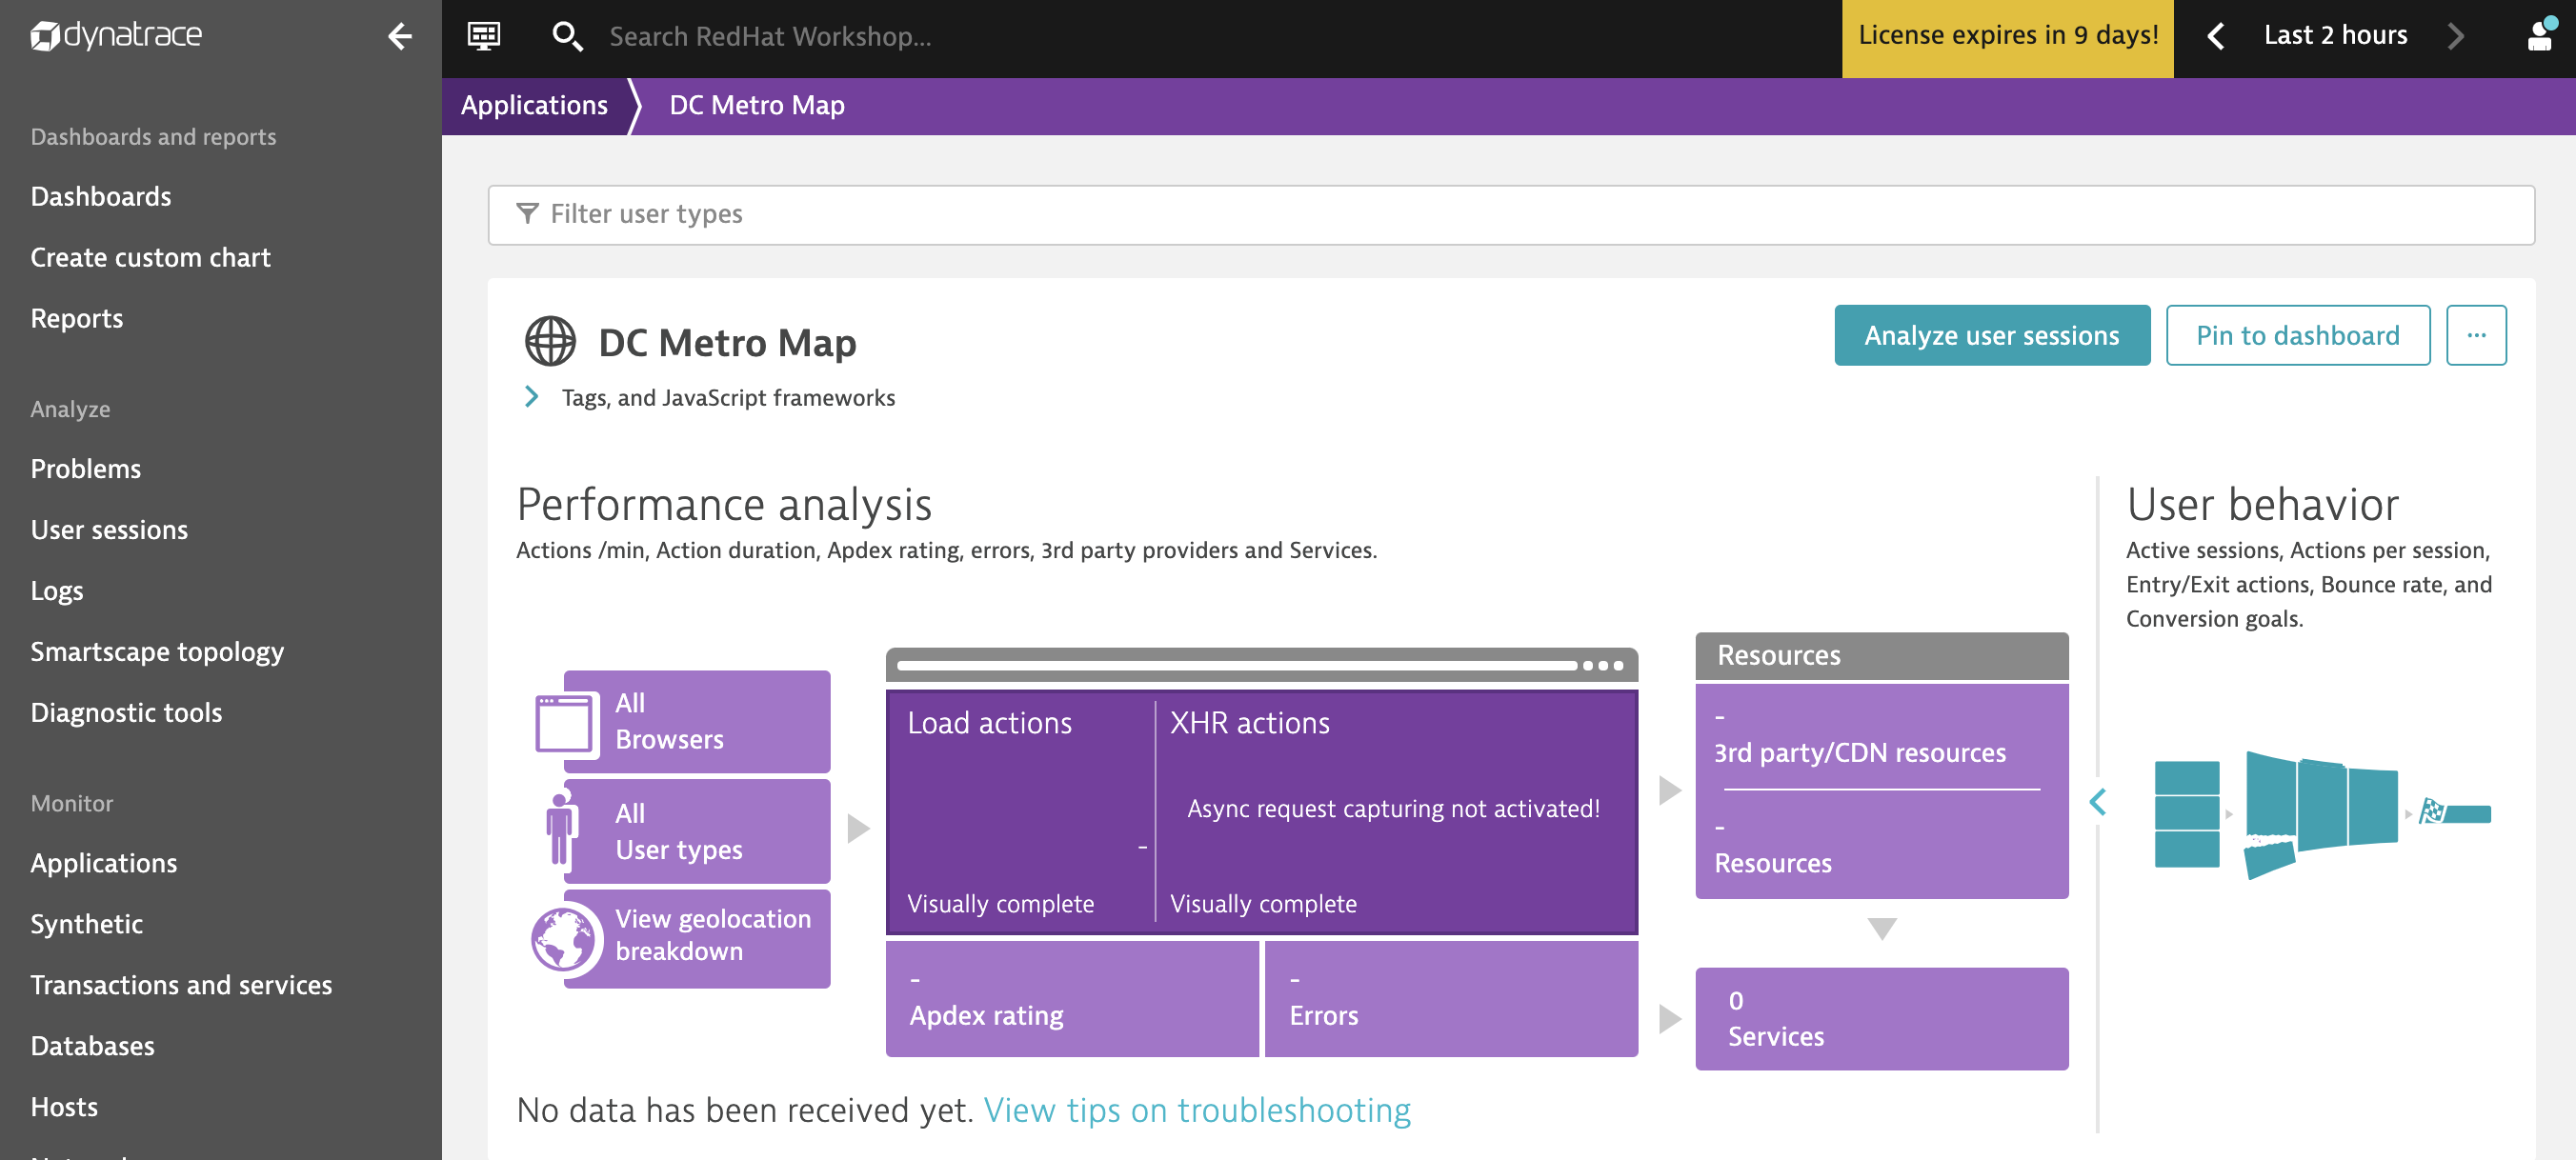
To verify you created the new application in Dynatrace, select “Applications” in the upper left corner and click on “DC Metro Map” in the center section.
No user interaction with the DC Metro Map application will be detected until you go back to the application interface and navigate the elements again. It will still take a couple of minutes for the data to be processed and data to start populating this view.
Summary
In this lab we deployed a sample application using source to image. This process built our code and wrapped that in a docker image. It then deployed the image into our OpenShift platform in a pod and exposed a route to allow outside web traffic to access our application. We then examined the discovered architecture of the application in Dynatrace. In the next lab we will deploy a multi-tier that includes a frontend, backend, and database tier.
Workshop Details
| Domain |
|
|
| Workshop | ||
| Student ID |
Workshop Details
| Domain |
|
|
| Workshop | ||
| Student ID |