Service Mesh Metrics with Grafana
Grafana is a monitoring tool that can be integrated with Istio for metric observation. Using Grafana, you can look at metrics associated with services in your mesh. Let’s use Grafana to get more information about the user profile service.
Explore Grafana
First, let’s explore the Grafana user interface.
Open the Grafana console. Retrieve the endpoint for Grafana:
GRAFANA_CONSOLE=$(oc get route grafana -n istio-system --template='https://{{.spec.host}}')
echo $GRAFANA_CONSOLE
Click 'Allow selected permissions' if prompted to authorized access.
Navigate to this URL in the browser. Login with the same credentials you were provided to access OpenShift.
Once logged in, you should be presented with the Grafana console:
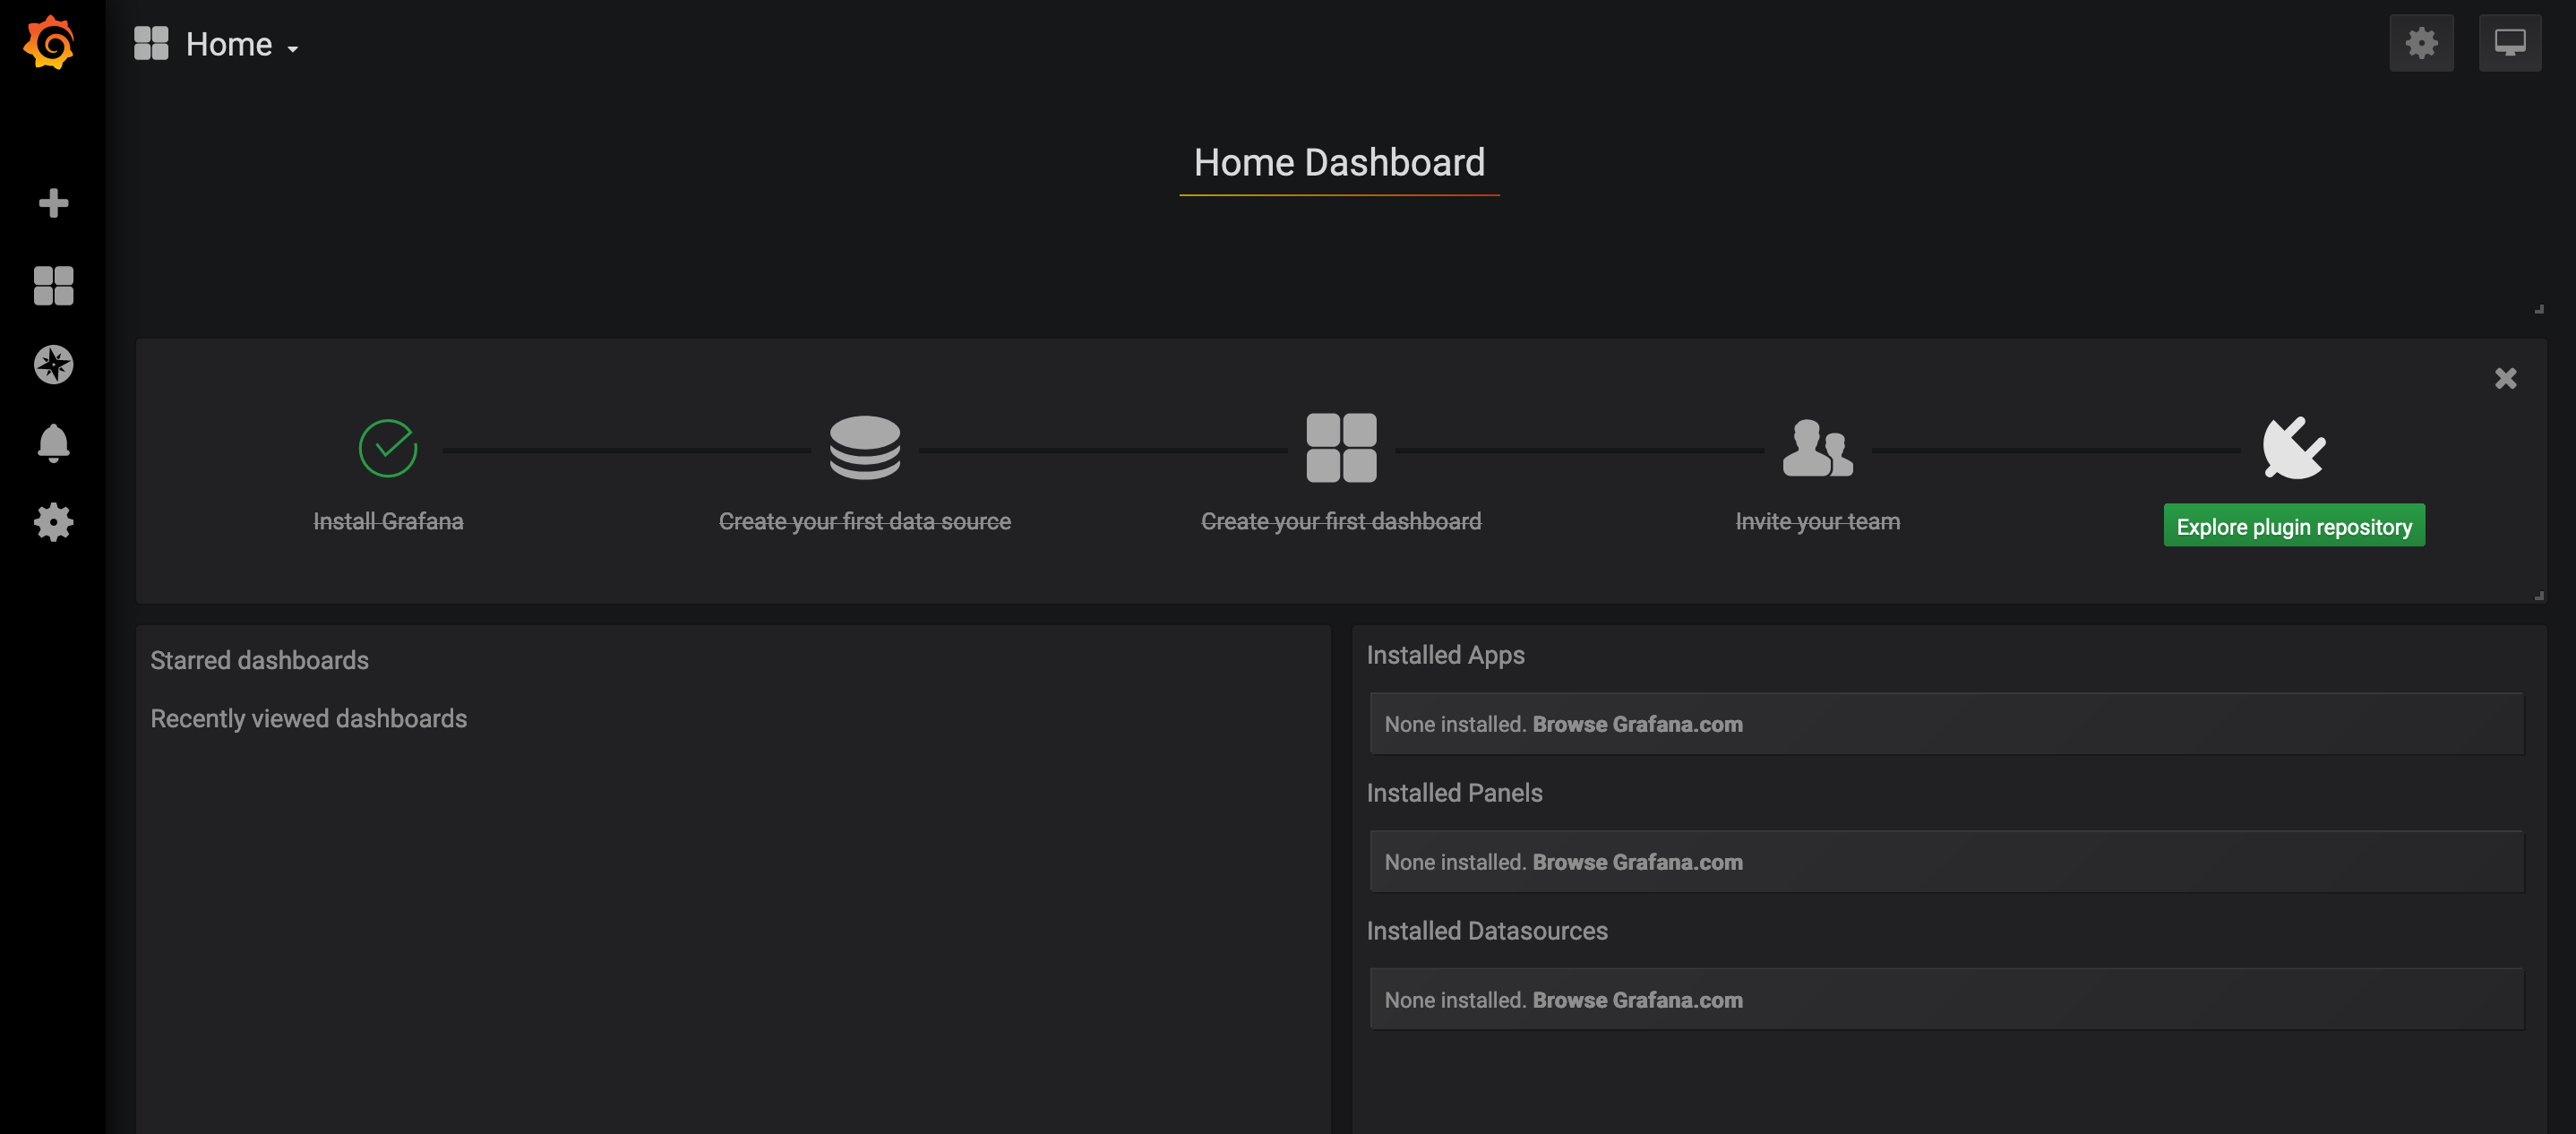
Grafana Welcome
On the left bar, hover over the second icon from the top (Dashboards) and select 'Manage'. Expand the 'istio' folder.
It should look like this:
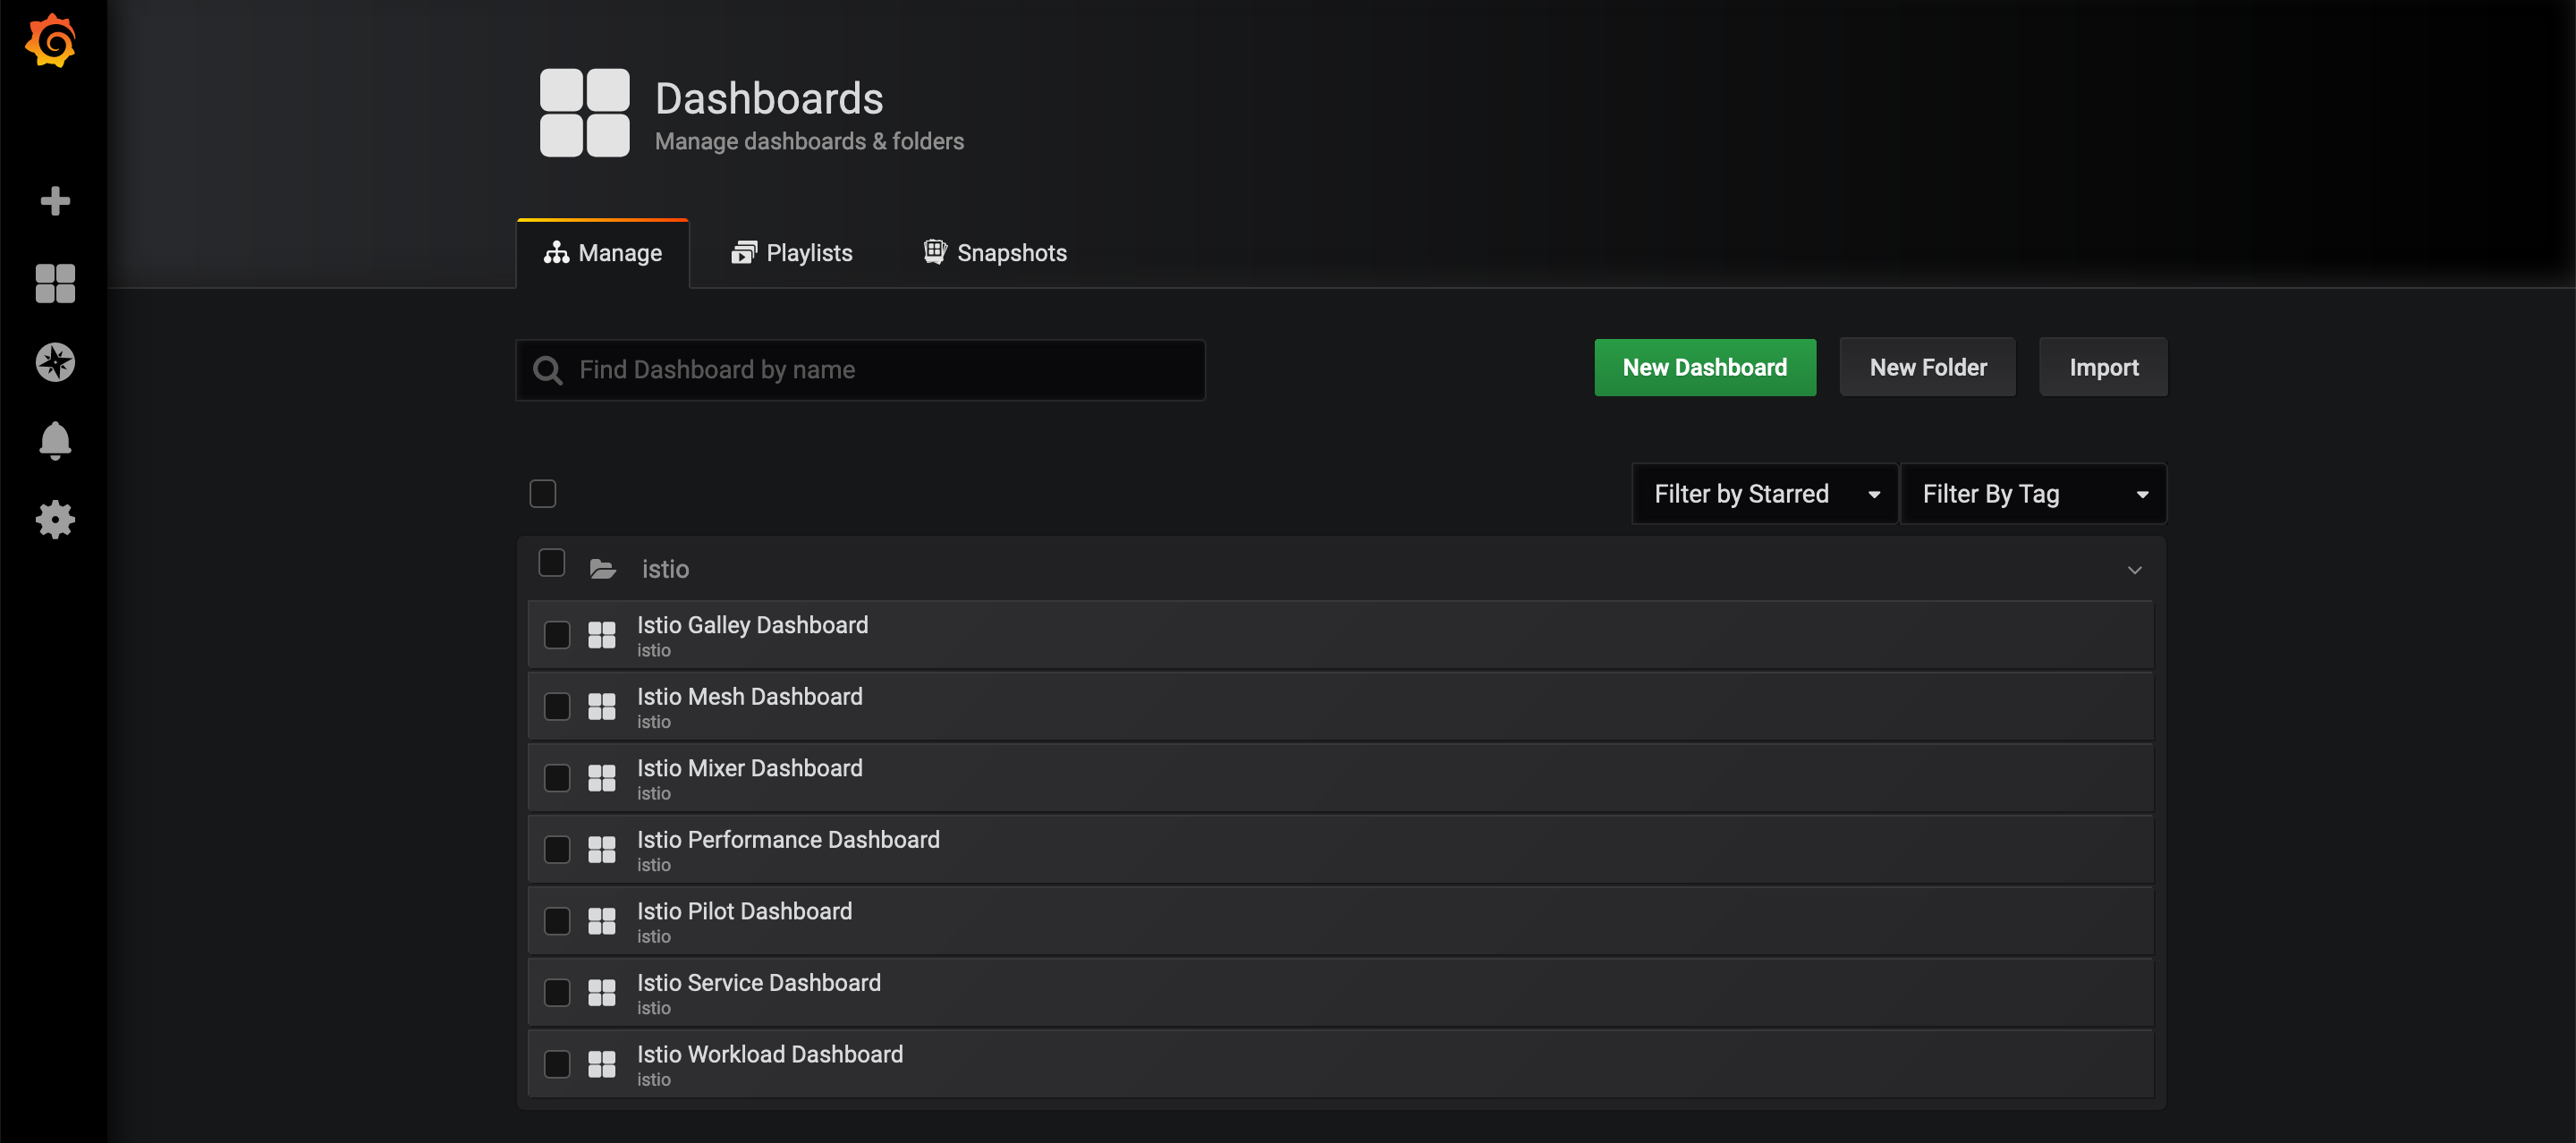
Grafana Istio Dashboards
You need to send load to the application before viewing any metrics.
Send load to the application user interface:
while true; do curl -s -o /dev/null $GATEWAY_URL; done
While that is running, let’s look at some dashboards.
Select 'Istio Mesh Dashboard' in Grafana.
It should look like this:
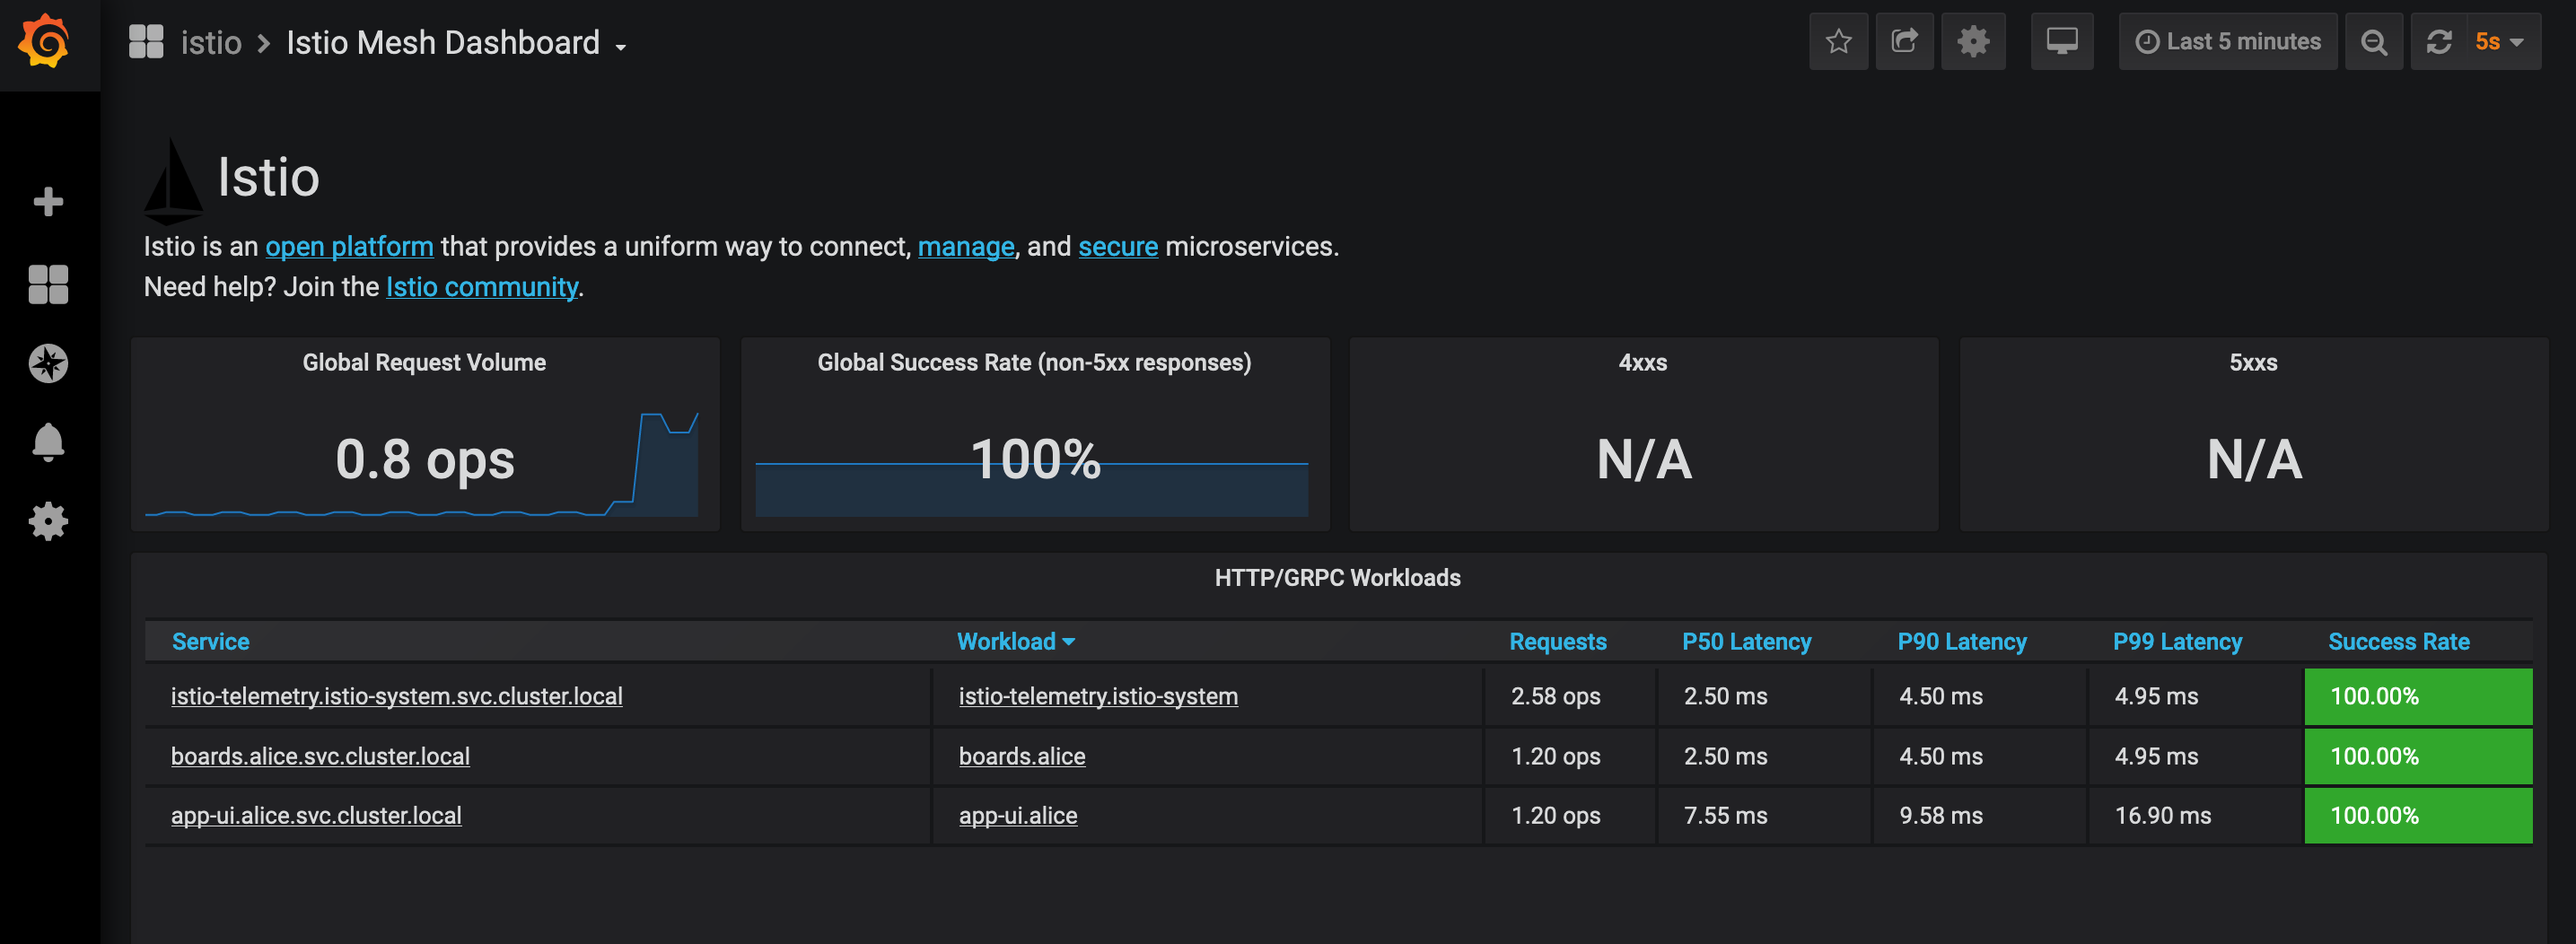
Grafana Istio Mesh Dashboard
This gives you a holistic view of your services and metrics associated with those services. For example, you can see that globally there are no error responses, and you get a quick snapshot of the throughput and latencies for each service. But we’re missing data on the user profile service so let’s send some load to that service.
Send that terminal job to the background:
^Z
[1]+  Stopped                 curl -s -o /dev/null $GATEWAY_URL
bg
[1]+ curl -s -o /dev/null $GATEWAY_URL &
Now, send load to the user profile service:
GATEWAY_URL=$(oc get route istio-demogateway-$(oc project -q) --template='http://{{.spec.host}}')
while true; do curl -s -o /dev/null $GATEWAY_URL/profile; done
The mesh dashboard should dynamically update. It should look like this now:
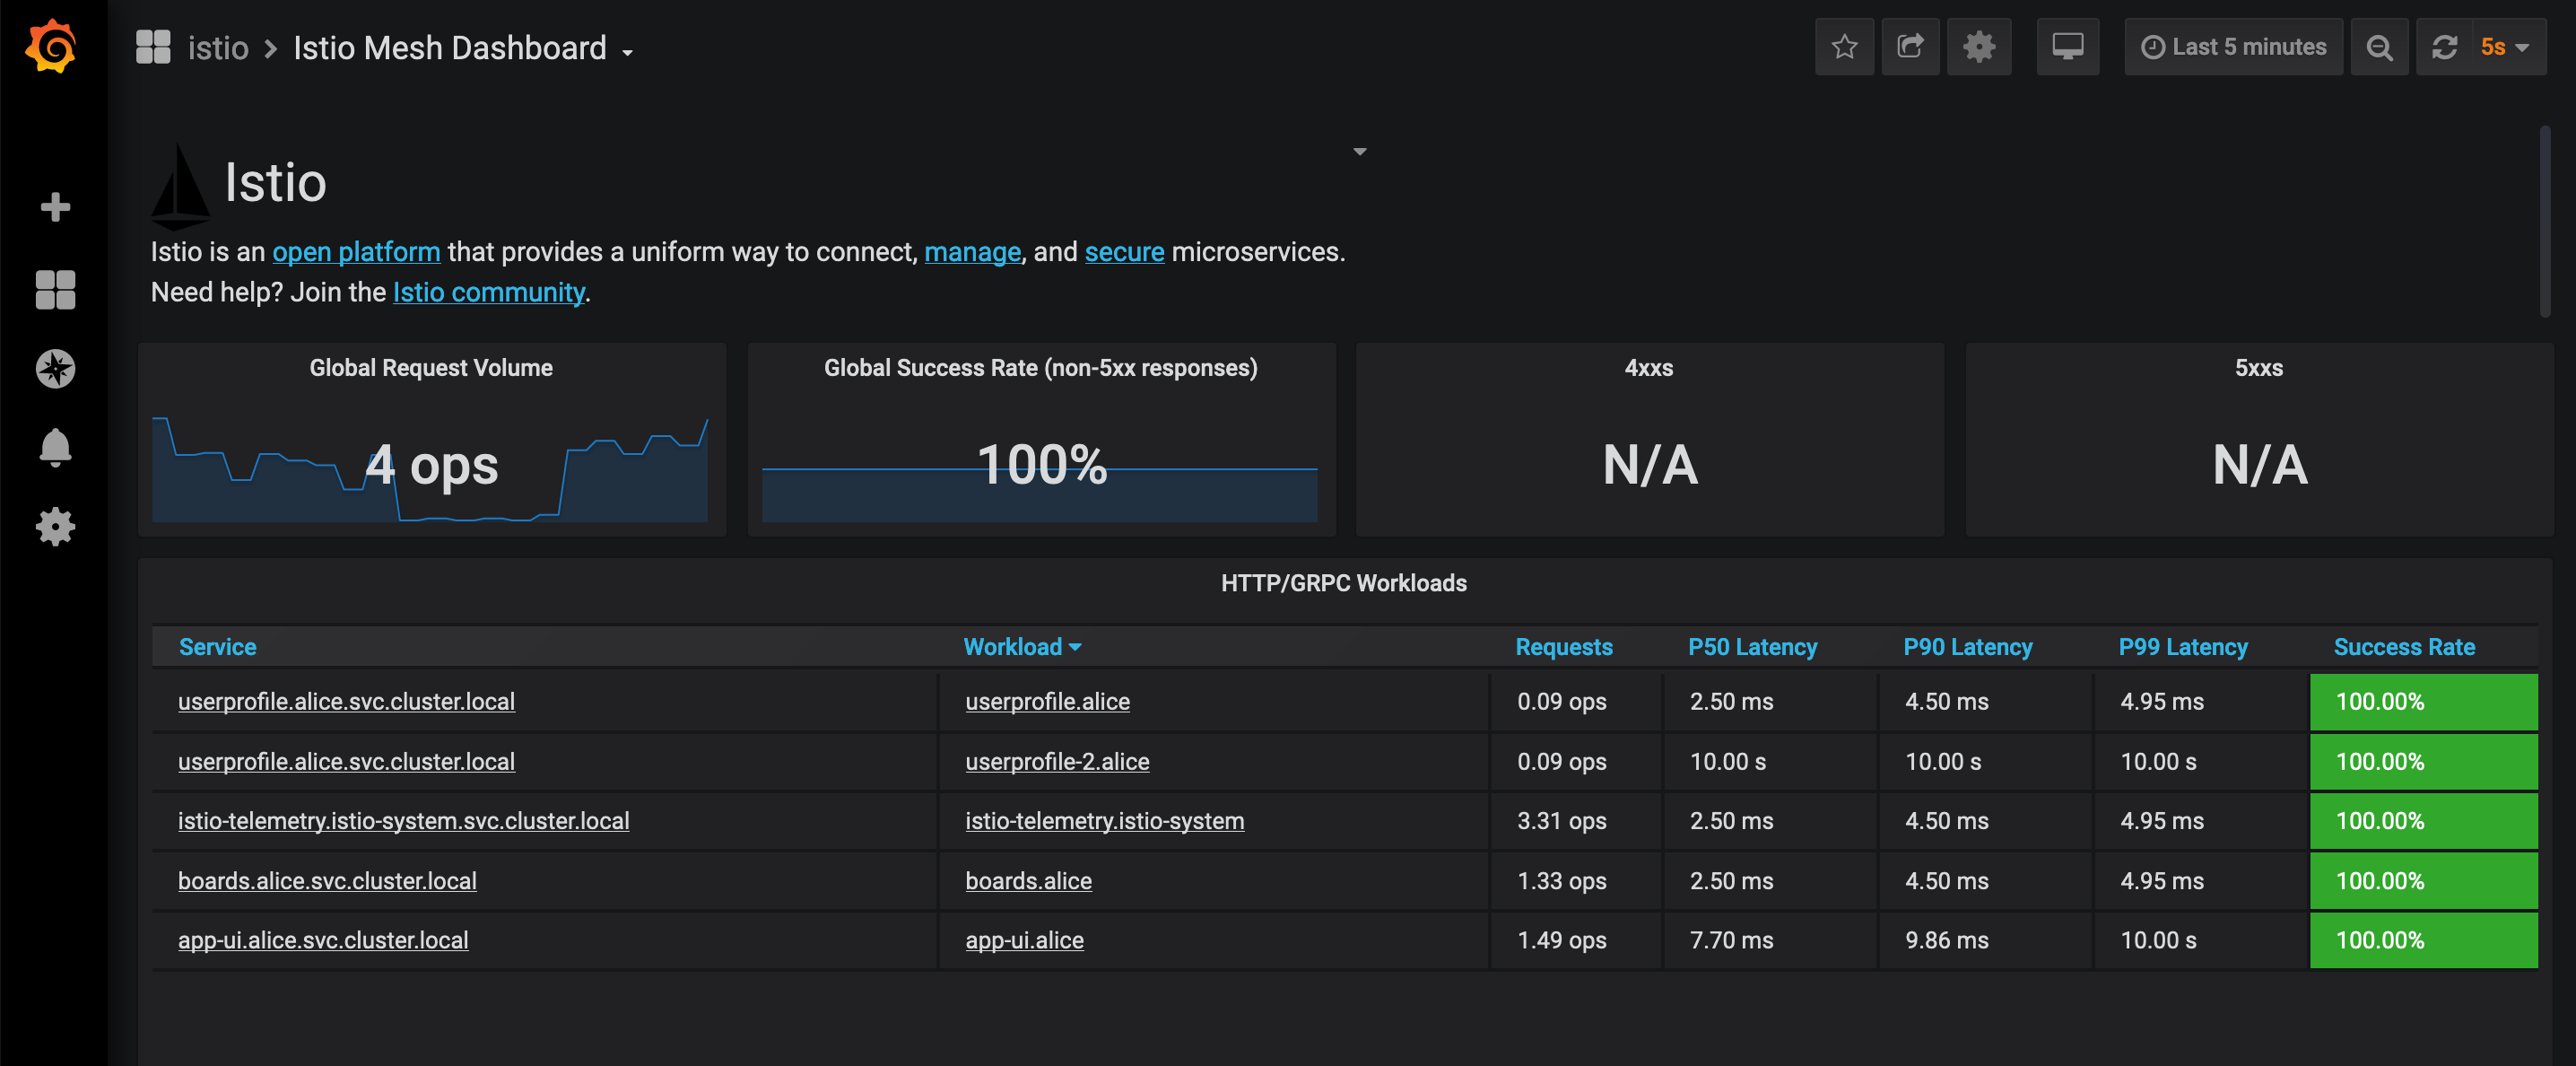
Grafana Istio Mesh Dashboard Updated
Notice the userprofile service has two different workloads: userprofile (version 1) and userprofile-2. Calls to userprofile-2 are vastly slower. You can further inspect the metrics associated with the service by selecting the service dashboard.
In the Service column, hover over the userprofile FQDN and select it.
That will take you to the service view, it looks like this:
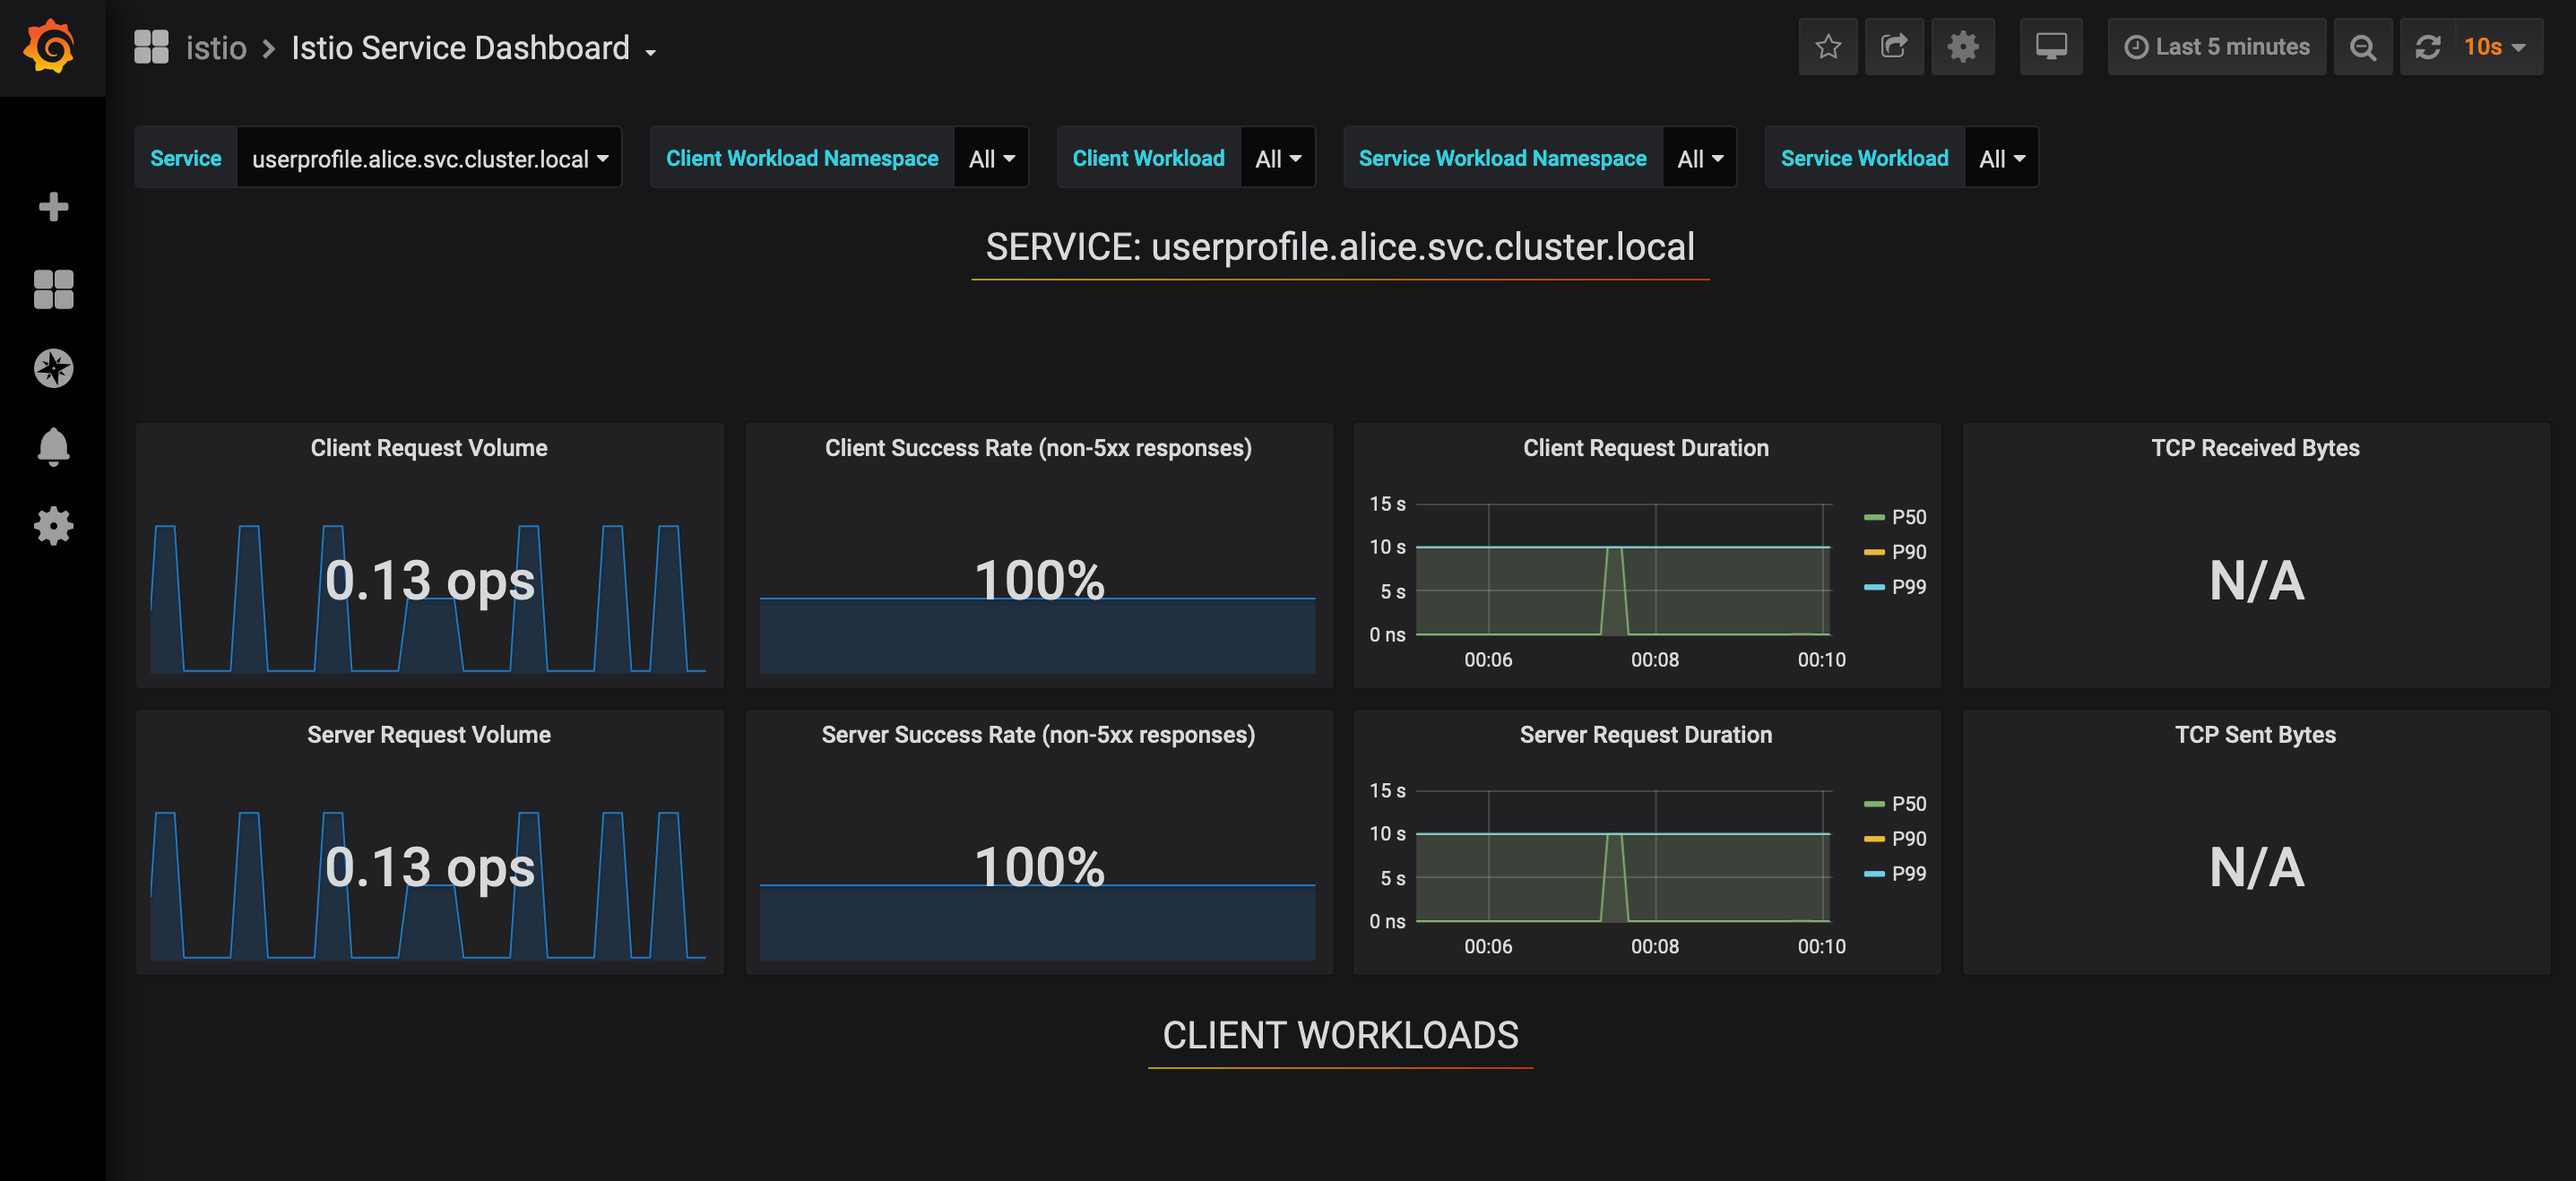
Grafana Istio Service Dashboard
These are metrics specific to the user profile service. Scroll down under ‘Service Workloads’ and you can see a breakdown of how the different workload versions differ for that service.
Hover over the Incoming Request Duration by Source under 'Service Workloads'.
It should look like this:
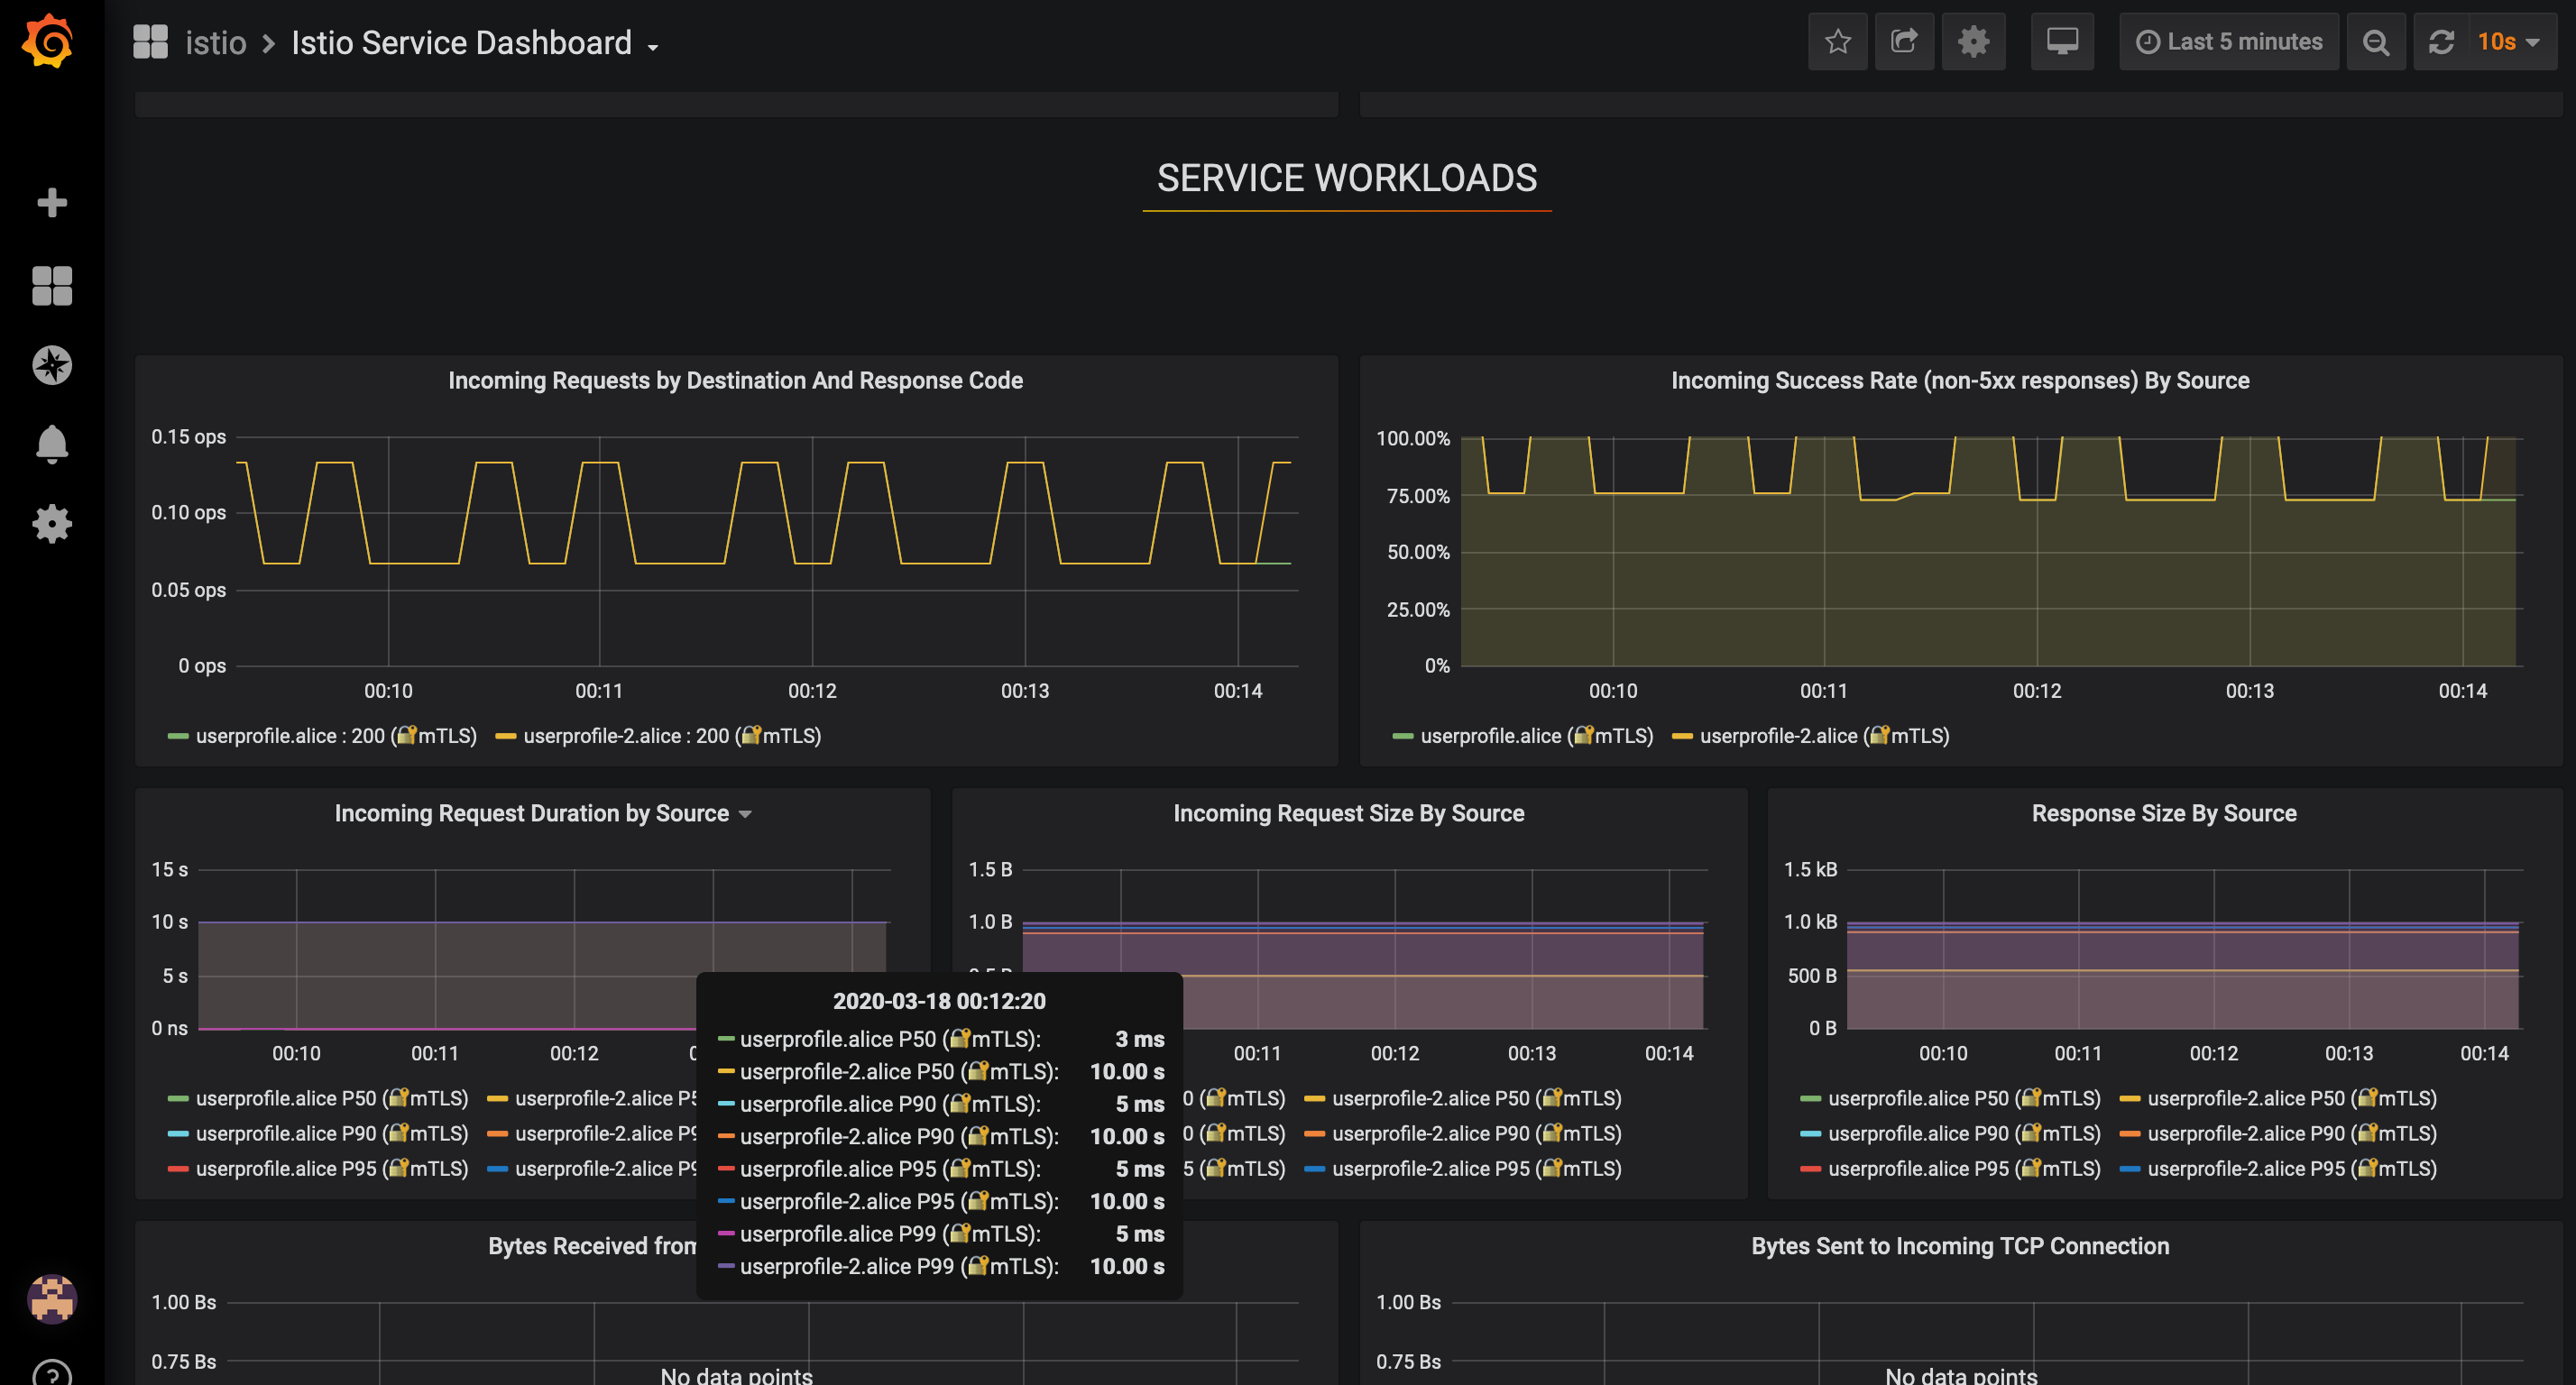
Grafana Istio Service Dashboard - Request Duration
This provides a visual representation of the latencies we saw on the Mesh Dashboard, and it is clear that the version 2 latencies are much higher.
Workshop Details
| Domain |
|
|
| Workshop | ||
| Student ID |
Workshop Details
| Domain |
|
|
| Workshop | ||
| Student ID |